NEW YORK, Aug. 23, 2022 /PRNewswire/ — Alkyl polyglucosides (APG) are non-ionic surfactants that are produced from fatty alcohols and glucose. They are bio-degradable in nature and are used in a variety of applications such as cosmetics, personal care, and industrial. APG surfactants are eco-friendly and biodegradable surfactants.
 Market by Application and Geography - Forecast and Analysis 2022-2026")
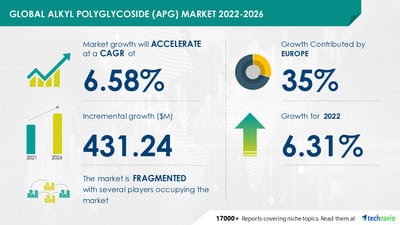
The alkyl polyglycoside (APG) market size is expected to grow by USD 431.24 mn between 2021 and 2026. In addition, the growth momentum of the market will accelerate at a CAGR of 6.58%, according to Technavio’s latest estimates.
This report offers an up-to-date analysis of the current market scenario, the latest trends and drivers, and the overall market environment to help businesses obtain growth opportunities. Read a FREE PDF Sample Report
To help businesses improve their market position, Technavio’s report provides a detailed analysis of around 25 vendors operating in the market. Some of the major vendors of the alkyl polyglycoside (APG) market include BASF SE, China National Chemical Corp. Ltd., Clariant International Ltd., Croda International Plc, Dadia Chemicals Industries, FENCHEM, Hugo New Materials (Wuxi) Co. Ltd., Huntsman Corp., IRO Group Inc., Kao Corp., LG Household and Health Care Ltd., Libra Speciality Chemicals Ltd, Pilot Chemical Co., SEPPIC SA, Shanghai Fakai Chemical Co. Ltd., Shiv Shakti Group, Silver Fern Chemical Inc., SpecialChem S.A., The Dow Chemical Co., and Yangzhou Chenhua New Materials Co. Ltd.
- Alkyl Polyglycoside (APG) Market size
- Alkyl Polyglycoside (APG) Market trends
- Alkyl Polyglycoside (APG) Market industry analysis
Get lifetime access to our Technavio Insights. Subscribe now to our “Basic Plan” billed annually at USD 5000.
- Application
- Home Care Products: The home care products segment will contribute the highest market share growth during the forecast period. The growth of this segment is driven by factors such as the significant increase in the demand for APG in home care products.
- Personal Care
- Industrial Cleaners
- Agricultural Chemicals
- Others
- Geography
- Europe: This region will account for 35% of the market’s growth during the forecast period. The growth of this region is attributed to factors such as the significant increase in the use of APG in home care products, personal care products, and other products. However, market growth in this region will be slower than the growth of the market in other regions. Germany is the country for the alkyl polyglycoside (APG) market in Europe.
- North America
- APAC
- South America
- Middle East And Africa
Learn about the contribution of each segment summarized in concise infographics and thorough descriptions. View a FREE PDF Sample Report
- CAGR of the market during the forecast period 2022-2026
- Detailed information on factors that will assist alkyl polyglycoside (APG) market growth during the next five years
- Estimation of the alkyl polyglycoside (APG) market size and its contribution to the parent market
- Predictions on upcoming trends and changes in consumer behavior
- The growth of the alkyl polyglycoside (APG) market
- Analysis of the market’s competitive landscape and detailed information on vendors
- Comprehensive details of factors that will challenge the growth of alkyl polyglycoside (APG) market vendors
Ethoxylates Market by End-user, Type, and Geography – Forecast and Analysis 2021-2025
Trimethylamine Market by Application and Geography – Forecast and Analysis 2022-2026
|
Alkyl Polyglycoside (APG) Market Scope |
|
|
Report Coverage |
Details |
|
Page number |
120 |
|
Base year |
2021 |
|
Forecast period |
2022-2026 |
|
Growth momentum & CAGR |
Accelerate at a CAGR of 6.58% |
|
Market growth 2022-2026 |
USD 431.24 million |
|
Market structure |
Fragmented |
|
YoY growth (%) |
6.31 |
|
Regional analysis |
Europe, North America, APAC, South America, and Middle East and Africa |
|
Performing market contribution |
Europe at 35% |
|
Key consumer countries |
US, Canada, China, Japan, India, and Germany |
|
Competitive landscape |
Leading companies, competitive strategies, consumer engagement scope |
|
Companies profiled |
BASF SE, China National Chemical Corp. Ltd., Clariant International Ltd., Croda International Plc, Dadia Chemicals Industries, FENCHEM, Hugo New Materials (Wuxi) Co. Ltd., Huntsman Corp., IRO Group Inc., Kao Corp., LG Household and Health Care Ltd., Libra Speciality Chemicals Ltd, Pilot Chemical Co., SEPPIC SA, Shanghai Fakai Chemical Co. Ltd., Shiv Shakti Group, Silver Fern Chemical Inc., SpecialChem S.A., The Dow Chemical Co., and Yangzhou Chenhua New Materials Co. Ltd. |
|
Market Dynamics |
Parent market analysis, market growth inducers and obstacles, fast-growing and slow-growing segment analysis, COVID-19 impact and future consumer dynamics, and market condition analysis for the forecast period. |
|
Customization purview |
If our report has not included the data that you are looking for, you can reach out to our analysts and get segments customized. |
Browse Specialty Chemicals Market Reports
1 Executive Summary
- 1.1 Market overview
- Exhibit 01: Executive Summary – Chart on Market Overview
- Exhibit 02: Executive Summary – Data Table on Market Overview
- Exhibit 03: Executive Summary – Chart on Global Market Characteristics
- Exhibit 04: Executive Summary – Chart on Market by Geography
- Exhibit 05: Executive Summary – Chart on Market Segmentation by Application
- Exhibit 06: Executive Summary – Chart on Incremental Growth
- Exhibit 07: Executive Summary – Data Table on Incremental Growth
- Exhibit 08: Executive Summary – Chart on Vendor Market Positioning
2 Market Landscape
- 2.1 Market ecosystem
- Exhibit 09: Parent market
- Exhibit 10: Market Characteristics
3 Market Sizing
- 3.1 Market definition
- Exhibit 11: Offerings of vendors included in the market definition
- 3.2 Market segment analysis
- Exhibit 12: Market segments
- 3.3 Market size 2021
- 3.4 Market outlook: Forecast for 2021-2026
- Exhibit 13: Chart on Global – Market size and forecast 2021-2026 ($ million)
- Exhibit 14: Data Table on Global – Market size and forecast 2021-2026 ($ million)
- Exhibit 15: Chart on Global Market: Year-over-year growth 2021-2026 (%)
- Exhibit 16: Data Table on Global Market: Year-over-year growth 2021-2026 (%)
4 Five Forces Analysis
- 4.1 Five forces summary
- Exhibit 17: Five forces analysis – Comparison between2021 and 2026
- 4.2 Bargaining power of buyers
- Exhibit 18: Chart on Bargaining power of buyers – Impact of key factors 2021 and 2026
- 4.3 Bargaining power of suppliers
- Exhibit 19: Bargaining power of suppliers – Impact of key factors in 2021 and 2026
- 4.4 Threat of new entrants
- Exhibit 20: Threat of new entrants – Impact of key factors in 2021 and 2026
- 4.5 Threat of substitutes
- Exhibit 21: Threat of substitutes – Impact of key factors in 2021 and 2026
- 4.6 Threat of rivalry
- Exhibit 22: Threat of rivalry – Impact of key factors in 2021 and 2026
- 4.7 Market condition
- Exhibit 23: Chart on Market condition – Five forces 2021 and 2026
5 Market Segmentation by Application
- 5.1 Market segments
- Exhibit 24: Chart on Application – Market share 2021-2026 (%)
- Exhibit 25: Data Table on Application – Market share 2021-2026 (%)
- 5.2 Comparison by Application
- Exhibit 26: Chart on Comparison by Application
- Exhibit 27: Data Table on Comparison by Application
- 5.3 Home care products – Market size and forecast 2021-2026
- Exhibit 28: Chart on Home care products – Market size and forecast 2021-2026 ($ million)
- Exhibit 29: Data Table on Home care products – Market size and forecast 2021-2026 ($ million)
- Exhibit 30: Chart on Home care products – Year-over-year growth 2021-2026 (%)
- Exhibit 31: Data Table on Home care products – Year-over-year growth 2021-2026 (%)
- 5.4 Personal care – Market size and forecast 2021-2026
- Exhibit 32: Chart on Personal care – Market size and forecast 2021-2026 ($ million)
- Exhibit 33: Data Table on Personal care – Market size and forecast 2021-2026 ($ million)
- Exhibit 34: Chart on Personal care – Year-over-year growth 2021-2026 (%)
- Exhibit 35: Data Table on Personal care – Year-over-year growth 2021-2026 (%)
- 5.5 Industrial cleaners – Market size and forecast 2021-2026
- Exhibit 36: Chart on Industrial cleaners – Market size and forecast 2021-2026 ($ million)
- Exhibit 37: Data Table on Industrial cleaners – Market size and forecast 2021-2026 ($ million)
- Exhibit 38: Chart on Industrial cleaners – Year-over-year growth 2021-2026 (%)
- Exhibit 39: Data Table on Industrial cleaners – Year-over-year growth 2021-2026 (%)
- 5.6 Agricultural chemicals – Market size and forecast 2021-2026
- Exhibit 40: Chart on Agricultural chemicals – Market size and forecast 2021-2026 ($ million)
- Exhibit 41: Data Table on Agricultural chemicals – Market size and forecast 2021-2026 ($ million)
- Exhibit 42: Chart on Agricultural chemicals – Year-over-year growth 2021-2026 (%)
- Exhibit 43: Data Table on Agricultural chemicals – Year-over-year growth 2021-2026 (%)
- 5.7 Others – Market size and forecast 2021-2026
- Exhibit 44: Chart on Others – Market size and forecast 2021-2026 ($ million)
- Exhibit 45: Data Table on Others – Market size and forecast 2021-2026 ($ million)
- Exhibit 46: Chart on Others – Year-over-year growth 2021-2026 (%)
- Exhibit 47: Data Table on Others – Year-over-year growth 2021-2026 (%)
- 5.8 Market opportunity by Application
- Exhibit 48: Market opportunity by Application ($ million)
6 Customer Landscape
- 6.1 Customer landscape overview
- Exhibit 49: Analysis of price sensitivity, lifecycle, customer purchase basket, adoption rates, and purchase criteria
7 Geographic Landscape
- 7.1 Geographic segmentation
- Exhibit 50: Chart on Market share by geography 2021-2026 (%)
- Exhibit 51: Data Table on Market share by geography 2021-2026 (%)
- 7.2 Geographic comparison
- Exhibit 52: Chart on Geographic comparison
- Exhibit 53: Data Table on Geographic comparison
- 7.3 Europe – Market size and forecast 2021-2026
- Exhibit 54: Chart on Europe – Market size and forecast 2021-2026 ($ million)
- Exhibit 55: Data Table on Europe – Market size and forecast 2021-2026 ($ million)
- Exhibit 56: Chart on Europe – Year-over-year growth 2021-2026 (%)
- Exhibit 57: Data Table on Europe – Year-over-year growth 2021-2026 (%)
- 7.4 North America – Market size and forecast 2021-2026
- Exhibit 58: Chart on North America – Market size and forecast 2021-2026 ($ million)
- Exhibit 59: Data Table on North America – Market size and forecast 2021-2026 ($ million)
- Exhibit 60: Chart on North America – Year-over-year growth 2021-2026 (%)
- Exhibit 61: Data Table on North America – Year-over-year growth 2021-2026 (%)
- 7.5 APAC – Market size and forecast 2021-2026
- Exhibit 62: Chart on APAC – Market size and forecast 2021-2026 ($ million)
- Exhibit 63: Data Table on APAC – Market size and forecast 2021-2026 ($ million)
- Exhibit 64: Chart on APAC – Year-over-year growth 2021-2026 (%)
- Exhibit 65: Data Table on APAC – Year-over-year growth 2021-2026 (%)
- 7.6 South America – Market size and forecast 2021-2026
- Exhibit 66: Chart on South America – Market size and forecast 2021-2026 ($ million)
- Exhibit 67: Data Table on South America – Market size and forecast 2021-2026 ($ million)
- Exhibit 68: Chart on South America – Year-over-year growth 2021-2026 (%)
- Exhibit 69: Data Table on South America – Year-over-year growth 2021-2026 (%)
- 7.7 Middle East and Africa – Market size and forecast 2021-2026
- Exhibit 70: Chart on Middle East and Africa – Market size and forecast 2021-2026 ($ million)
- Exhibit 71: Data Table on Middle East and Africa – Market size and forecast 2021-2026 ($ million)
- Exhibit 72: Chart on Middle East and Africa – Year-over-year growth 2021-2026 (%)
- Exhibit 73: Data Table on Middle East and Africa – Year-over-year growth 2021-2026 (%)
- 7.8 China – Market size and forecast 2021-2026
- Exhibit 74: Chart on China – Market size and forecast 2021-2026 ($ million)
- Exhibit 75: Data Table on China – Market size and forecast 2021-2026 ($ million)
- Exhibit 76: Chart on China – Year-over-year growth 2021-2026 (%)
- Exhibit 77: Data Table on China – Year-over-year growth 2021-2026 (%)
- 7.9 US – Market size and forecast 2021-2026
- Exhibit 78: Chart on US – Market size and forecast 2021-2026 ($ million)
- Exhibit 79: Data Table on US – Market size and forecast 2021-2026 ($ million)
- Exhibit 80: Chart on US – Year-over-year growth 2021-2026 (%)
- Exhibit 81: Data Table on US – Year-over-year growth 2021-2026 (%)
- 7.10 Japan – Market size and forecast 2021-2026
- Exhibit 82: Chart on Japan – Market size and forecast 2021-2026 ($ million)
- Exhibit 83: Data Table on Japan – Market size and forecast 2021-2026 ($ million)
- Exhibit 84: Chart on Japan – Year-over-year growth 2021-2026 (%)
- Exhibit 85: Data Table on Japan – Year-over-year growth 2021-2026 (%)
- 7.11 Germany – Market size and forecast 2021-2026
- Exhibit 86: Chart on Germany – Market size and forecast 2021-2026 ($ million)
- Exhibit 87: Data Table on Germany – Market size and forecast 2021-2026 ($ million)
- Exhibit 88: Chart on Germany – Year-over-year growth 2021-2026 (%)
- Exhibit 89: Data Table on Germany – Year-over-year growth 2021-2026 (%)
- 7.12 India – Market size and forecast 2021-2026
- Exhibit 90: Chart on India – Market size and forecast 2021-2026 ($ million)
- Exhibit 91: Data Table on India – Market size and forecast 2021-2026 ($ million)
- Exhibit 92: Chart on India – Year-over-year growth 2021-2026 (%)
- Exhibit 93: Data Table on India – Year-over-year growth 2021-2026 (%)
- 7.13 Canada – Market size and forecast 2021-2026
- Exhibit 94: Chart on Canada – Market size and forecast 2021-2026 ($ million)
- Exhibit 95: Data Table on Canada – Market size and forecast 2021-2026 ($ million)
- Exhibit 96: Chart on Canada – Year-over-year growth 2021-2026 (%)
- Exhibit 97: Data Table on Canada – Year-over-year growth 2021-2026 (%)
- 7.14 Market opportunity by geography
- Exhibit 98: Market opportunity by geography ($ million)
8 Drivers, Challenges, and Trends
- 8.1 Market drivers
- 8.2 Market challenges
- 8.3 Impact of drivers and challenges
- Exhibit 99: Impact of drivers and challenges in 2021 and 2026
- 8.4 Market trends
9 Vendor Landscape
- 9.1 Overview
- 9.2 Vendor landscape
- Exhibit 100: Overview on Criticality of inputs and Factors of differentiation
- 9.3 Landscape disruption
- Exhibit 101: Overview on factors of disruption
- 9.4 Industry risks
- Exhibit 102: Impact of key risks on business
10 Vendor Analysis
- 10.1 Vendors covered
- Exhibit 103: Vendors covered
- 10.2 Market positioning of vendors
- Exhibit 104: Matrix on vendor position and classification
- 10.3 BASF SE
- Exhibit 105: BASF SE – Overview
- Exhibit 106: BASF SE – Business segments
- Exhibit 107: BASF SE – Key news
- Exhibit 108: BASF SE – Key offerings
- Exhibit 109: BASF SE – Segment focus
- 10.4 Clariant International Ltd.
- Exhibit 110: Clariant International Ltd. – Overview
- Exhibit 111: Clariant International Ltd. – Business segments
- Exhibit 112: Clariant International Ltd. – Key news
- Exhibit 113: Clariant International Ltd. – Key offerings
- Exhibit 114: Clariant International Ltd. – Segment focus
- 10.5 Croda International Plc
- Exhibit 115: Croda International Plc – Overview
- Exhibit 116: Croda International Plc – Business segments
- Exhibit 117: Croda International Plc – Key news
- Exhibit 118: Croda International Plc – Key offerings
- Exhibit 119: Croda International Plc – Segment focus
- 10.6 FENCHEM
- Exhibit 120: FENCHEM – Overview
- Exhibit 121: FENCHEM – Product / Service
- Exhibit 122: FENCHEM – Key offerings
- 10.7 Huntsman Corp.
- Exhibit 123: Huntsman Corp. – Overview
- Exhibit 124: Huntsman Corp. – Business segments
- Exhibit 125: Huntsman Corp. – Key news
- Exhibit 126: Huntsman Corp. – Key offerings
- Exhibit 127: Huntsman Corp. – Segment focus
- 10.8 LG Household and Health Care Ltd.
- Exhibit 128: LG Household and Health Care Ltd. – Overview
- Exhibit 129: LG Household and Health Care Ltd. – Business segments
- Exhibit 130: LG Household and Health Care Ltd. – Key news
- Exhibit 131: LG Household and Health Care Ltd. – Key offerings
- Exhibit 132: LG Household and Health Care Ltd. – Segment focus
- 10.9 Shanghai Fakai Chemical Co. Ltd.
- Exhibit 133: Shanghai Fakai Chemical Co. Ltd. – Overview
- Exhibit 134: Shanghai Fakai Chemical Co. Ltd. – Product / Service
- Exhibit 135: Shanghai Fakai Chemical Co. Ltd. – Key offerings
- 10.10 SpecialChem S.A.
- Exhibit 136: SpecialChem S.A. – Overview
- Exhibit 137: SpecialChem S.A. – Product / Service
- Exhibit 138: SpecialChem S.A. – Key offerings
- 10.11 The Dow Chemical Co.
- Exhibit 139: The Dow Chemical Co. – Overview
- Exhibit 140: The Dow Chemical Co. – Business segments
- Exhibit 141: The Dow Chemical Co. – Key offerings
- Exhibit 142: The Dow Chemical Co. – Segment focus
- 10.12 Yangzhou Chenhua New Materials Co. Ltd.
- Exhibit 143: Yangzhou Chenhua New Materials Co. Ltd. – Overview
- Exhibit 144: Yangzhou Chenhua New Materials Co. Ltd. – Product / Service
- Exhibit 145: Yangzhou Chenhua New Materials Co. Ltd. – Key offerings
11 Appendix
- 11.1 Scope of the report
- 11.2 Inclusions and exclusions checklist
- Exhibit 146: Inclusions checklist
- Exhibit 147: Exclusions checklist
- 11.3 Currency conversion rates for US$
- Exhibit 148: Currency conversion rates for US$
- 11.4 Research methodology
- Exhibit 149: Research methodology
- Exhibit 150: Validation techniques employed for market sizing
- Exhibit 151: Information sources
- 11.5 List of abbreviations
- Exhibit 152: List of abbreviations
Technavio is a leading global technology research and advisory company. Their research and analysis focus on emerging market trends and provide actionable insights to help businesses identify market opportunities and develop effective strategies to optimize their market positions. With over 500 specialized analysts, Technavio’s report library consists of more than 17,000 reports and counting, covering 800 technologies, spanning across 50 countries. Their client base consists of enterprises of all sizes, including more than 100 Fortune 500 companies. This growing client base relies on Technavio’s comprehensive coverage, extensive research, and actionable market insights to identify opportunities in existing and potential markets and assess their competitive positions within changing market scenarios.
Contact
Technavio Research
Jesse Maida
Media & Marketing Executive
US: +1 844 364 1100
UK: +44 203 893 3200
Email: media@technavio.com
Website: www.technavio.com/
![]()
![]() View original content to download multimedia:https://www.prnewswire.com/news-releases/which-region-will-dominate-the-alkyl-polyglycoside-apg-market-find-out-in-technavios-market-analysis-report-301609253.html
View original content to download multimedia:https://www.prnewswire.com/news-releases/which-region-will-dominate-the-alkyl-polyglycoside-apg-market-find-out-in-technavios-market-analysis-report-301609253.html
SOURCE Technavio

Source link
The content is by PR Newswire. Headlines of Today Media is not responsible for the content provided or any links related to this content. Headlines of Today Media is not responsible for the correctness, topicality or the quality of the content.