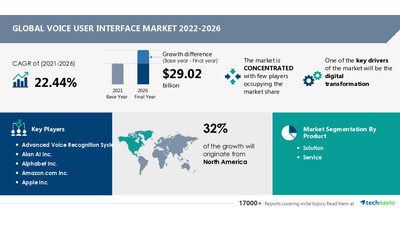
NEW YORK, May 24, 2022 /PRNewswire/ — The voice user interface market size is expected to grow by USD 29.02 billion from 2021 to 2026. Moreover, the growth momentum of the market will accelerate at a CAGR of 22.44% during the forecast period. The digital transformation is driving the VUI market growth. However, factors such as cybersecurity challenges associated with voice user interface may challenge the market growth.

To know more about market dynamics, Request a Sample Report
Voice User Interface Market: Driver and Challenge
Digital transformation in industries such as internet services, telecommunication, BFSI, healthcare, and media and entertainment is driving the growth of the market. Advanced internet technologies such as high-speed broadband and VoIP services have fueled the adoption of new technologies. Technologies such as Big Data analytics and AR are used in online learning programs.
Cybersecurity challenges associated with voice user interface will challenge the growth of the market during the forecast period. In many countries, network security in high-security zones is assumed to be a threat to national security due to the possibility of terrorist attacks. The increase in data sharing over a network leads to cybersecurity and data breach issues in the use of VUI over mobile and cloud networks. Some countries have restricted a few areas of VUI, such as vehicle and infrastructure communication, due to security concerns. Various governments mandate service providers to erase digital images of sensitive areas such as military bases, nuclear weapon sites, and border regions. In addition, VUI can be a potential target for hackers, which may lower its adoption in the coming years.
Find additional highlights related to other drivers and challenges and their impact on the growth of the market. Download a Sample Report Now
Voice User Interface Market: Segmentation by Product
Based on the segmentation by product, the market has been segmented into solution and service. The solution segment will have significant market share growth during the forecast period. The growing market penetration of connected devices and digital transformation is driving the growth of this segment. The consumers of voice user interface solutions include industrial, commercial, and individual consumers.
Voice User Interface Market: Segmentation by Geography
Based on geography, the market has been segmented into North America, APAC, Europe, the Middle East and Africa, and South America. North America will have the highest market share growth during the forecast period. End-user industries in the region, such as automotive, retail, healthcare, media and entertainment, hospitality, and BFSI, are adopting voice user interfaces in their operations. This enables them to have a competitive edge in the market and improve their operations. These factors will drive the voice user interface market growth in North America during the forecast period.
Voice User Interface Market: Major Vendors
Advanced Voice Recognition Systems Inc. – The company offers a voice user interface through its Speech recognition technology.
Alphabet Inc. – The company offers a voice user interface, namely Google Assistant.
Amazon.com Inc. – The company offers a voice user interface, namely Alexa.
Apple Inc. – The company offers a voice user interface, namely Siri.
Baidu Inc. – The company offers a voice user interface, namely DuerOS.
Along with the market data, Technavio offers customizations as per the specific needs of companies. Speak to our Analyst for a Customized Report
Related Reports:
Voice Commerce Market by Application and Geography – Forecast and Analysis 2022-2026
IT Monitoring Tools Market by Product and Geography – Forecast and Analysis 2022-2026
|
Voice User Interface Market Scope |
|
|
Report Coverage |
Details |
|
Page number |
120 |
|
Base year |
2021 |
|
Forecast period |
2022-2026 |
|
Growth momentum & CAGR |
Accelerate at a CAGR of 22.44% |
|
Market growth 2022-2026 |
USD 29.02 billion |
|
Market structure |
Concentrated |
|
YoY growth (%) |
20.46 |
|
Regional analysis |
North America, APAC, Europe, Middle East and Africa, and South America |
|
Performing market contribution |
North America at 32% |
|
Key consumer countries |
US, China, South Korea, UK, and Germany |
|
Competitive landscape |
Leading companies, Competitive strategies, Consumer engagement scope |
|
Key companies profiled |
Advanced Voice Recognition Systems Inc., Alan AI Inc., Alphabet Inc., Amazon.com Inc., Apple Inc., Baidu Inc., CastleOS Software LLC, International Business Machines Corp., Microsoft Corp., Picovoice Inc., Samsung Electronics Co. Ltd., Sonos Inc., SoundHound Inc., Speechly, Whatfix Pvt. Ltd., and Zaion SAS |
|
Market dynamics |
Parent market analysis, Market growth inducers and obstacles, Fast-growing and slow-growing segment analysis, COVID 19 impact and recovery analysis and future consumer dynamics, Market condition analysis for forecast period |
|
Customization purview |
If our report has not included the data that you are looking for, you can reach out to our analysts and get segments customized. |
Table of Contents
1 Executive Summary
- 1.1 Market overview
- Exhibit 01: Executive Summary – Chart on Market Overview
- Exhibit 02: Executive Summary – Data Table on Market Overview
- Exhibit 03: Executive Summary – Chart on Global Market Characteristics
- Exhibit 04: Executive Summary – Chart on Market by Geography
- Exhibit 05: Executive Summary – Chart on Market Segmentation by Product
- Exhibit 06: Executive Summary – Chart on Incremental Growth
- Exhibit 07: Executive Summary – Data Table on Incremental Growth
- Exhibit 08: Executive Summary – Chart on Vendor Market Positioning
2 Market Landscape
- 2.1 Market ecosystem
- Exhibit 09: Parent market
- Exhibit 10: Market Characteristics
3 Market Sizing
- 3.1 Market definition
- Exhibit 11: Offerings of vendors included in the market definition
- 3.2 Market segment analysis
- Exhibit 12: Market segments
- 3.3 Market size 2021
- 3.4 Market outlook: Forecast for 2021-2026
- Exhibit 13: Chart on Global – Market size and forecast 2021-2026 ($ million)
- Exhibit 14: Data Table on Global – Market size and forecast 2021-2026 ($ million)
- Exhibit 15: Chart on Global Market: Year-over-year growth 2021-2026 (%)
- Exhibit 16: Data Table on Global Market: Year-over-year growth 2021-2026 (%)
4 Five Forces Analysis
- 4.1 Five forces summary
- Exhibit 17: Five forces analysis – Comparison between 2021 and 2026
- 4.2 Bargaining power of buyers
- Exhibit 18: Chart on Bargaining power of buyers – Impact of key factors 2021 and 2026
- 4.3 Bargaining power of suppliers
- Exhibit 19: Bargaining power of suppliers – Impact of key factors in 2021 and 2026
- 4.4 Threat of new entrants
- Exhibit 20: Threat of new entrants – Impact of key factors in 2021 and 2026
- 4.5 Threat of substitutes
- Exhibit 21: Threat of substitutes – Impact of key factors in 2021 and 2026
- 4.6 Threat of rivalry
- Exhibit 22: Threat of rivalry – Impact of key factors in 2021 and 2026
- 4.7 Market condition
- Exhibit 23: Chart on Market condition – Five forces 2021 and 2026
5 Market Segmentation by Product
- 5.1 Market segments
- Exhibit 24: Chart on Product – Market share 2021-2026 (%)
- Exhibit 25: Data Table on Product – Market share 2021-2026 (%)
- 5.2 Comparison by Product
- Exhibit 26: Chart on Comparison by Product
- Exhibit 27: Data Table on Comparison by Product
- 5.3 Solution – Market size and forecast 2021-2026
- Exhibit 28: Chart on Solution – Market size and forecast 2021-2026 ($ million)
- Exhibit 29: Data Table on Solution – Market size and forecast 2021-2026 ($ million)
- Exhibit 30: Chart on Solution – Year-over-year growth 2021-2026 (%)
- Exhibit 31: Data Table on Solution – Year-over-year growth 2021-2026 (%)
- 5.4 Service – Market size and forecast 2021-2026
- Exhibit 32: Chart on Service – Market size and forecast 2021-2026 ($ million)
- Exhibit 33: Data Table on Service – Market size and forecast 2021-2026 ($ million)
- Exhibit 34: Chart on Service – Year-over-year growth 2021-2026 (%)
- Exhibit 35: Data Table on Service – Year-over-year growth 2021-2026 (%)
- 5.5 Market opportunity by Product
- Exhibit 36: Market opportunity by Product ($ million)
6 Customer Landscape
- 6.1 Customer landscape overview
- Exhibit 37: Analysis of price sensitivity, lifecycle, customer purchase basket, adoption rates, and purchase criteria
7 Geographic Landscape
- 7.1 Geographic segmentation
- Exhibit 38: Chart on Market share by geography 2021-2026 (%)
- Exhibit 39: Data Table on Market share by geography 2021-2026 (%)
- 7.2 Geographic comparison
- Exhibit 40: Chart on Geographic comparison
- Exhibit 41: Data Table on Geographic comparison
- 7.3 North America – Market size and forecast 2021-2026
- Exhibit 42: Chart on North America – Market size and forecast 2021-2026 ($ million)
- Exhibit 43: Data Table on North America – Market size and forecast 2021-2026 ($ million)
- Exhibit 44: Chart on North America – Year-over-year growth 2021-2026 (%)
- Exhibit 45: Data Table on North America – Year-over-year growth 2021-2026 (%)
- 7.4 APAC – Market size and forecast 2021-2026
- Exhibit 46: Chart on APAC – Market size and forecast 2021-2026 ($ million)
- Exhibit 47: Data Table on APAC – Market size and forecast 2021-2026 ($ million)
- Exhibit 48: Chart on APAC – Year-over-year growth 2021-2026 (%)
- Exhibit 49: Data Table on APAC – Year-over-year growth 2021-2026 (%)
- 7.5 Europe – Market size and forecast 2021-2026
- Exhibit 50: Chart on Europe – Market size and forecast 2021-2026 ($ million)
- Exhibit 51: Data Table on Europe – Market size and forecast 2021-2026 ($ million)
- Exhibit 52: Chart on Europe – Year-over-year growth 2021-2026 (%)
- Exhibit 53: Data Table on Europe – Year-over-year growth 2021-2026 (%)
- 7.6 Middle East and Africa – Market size and forecast 2021-2026
- Exhibit 54: Chart on Middle East and Africa – Market size and forecast 2021-2026 ($ million)
- Exhibit 55: Data Table on Middle East and Africa – Market size and forecast 2021-2026 ($ million)
- Exhibit 56: Chart on Middle East and Africa – Year-over-year growth 2021-2026 (%)
- Exhibit 57: Data Table on Middle East and Africa – Year-over-year growth 2021-2026 (%)
- 7.7 South America – Market size and forecast 2021-2026
- Exhibit 58: Chart on South America – Market size and forecast 2021-2026 ($ million)
- Exhibit 59: Data Table on South America – Market size and forecast 2021-2026 ($ million)
- Exhibit 60: Chart on South America – Year-over-year growth 2021-2026 (%)
- Exhibit 61: Data Table on South America – Year-over-year growth 2021-2026 (%)
- 7.8 US – Market size and forecast 2021-2026
- Exhibit 62: Chart on US – Market size and forecast 2021-2026 ($ million)
- Exhibit 63: Data Table on US – Market size and forecast 2021-2026 ($ million)
- Exhibit 64: Chart on US – Year-over-year growth 2021-2026 (%)
- Exhibit 65: Data Table on US – Year-over-year growth 2021-2026 (%)
- 7.9 China – Market size and forecast 2021-2026
- Exhibit 66: Chart on China – Market size and forecast 2021-2026 ($ million)
- Exhibit 67: Data Table on China – Market size and forecast 2021-2026 ($ million)
- Exhibit 68: Chart on China – Year-over-year growth 2021-2026 (%)
- Exhibit 69: Data Table on China – Year-over-year growth 2021-2026 (%)
- 7.10 UK – Market size and forecast 2021-2026
- Exhibit 70: Chart on UK – Market size and forecast 2021-2026 ($ million)
- Exhibit 71: Data Table on UK – Market size and forecast 2021-2026 ($ million)
- Exhibit 72: Chart on UK – Year-over-year growth 2021-2026 (%)
- Exhibit 73: Data Table on UK – Year-over-year growth 2021-2026 (%)
- 7.11 Germany – Market size and forecast 2021-2026
- Exhibit 74: Chart on Germany – Market size and forecast 2021-2026 ($ million)
- Exhibit 75: Data Table on Germany – Market size and forecast 2021-2026 ($ million)
- Exhibit 76: Chart on Germany – Year-over-year growth 2021-2026 (%)
- Exhibit 77: Data Table on Germany – Year-over-year growth 2021-2026 (%)
- 7.12 South Korea – Market size and forecast 2021-2026
- Exhibit 78: Chart on South Korea – Market size and forecast 2021-2026 ($ million)
- Exhibit 79: Data Table on South Korea – Market size and forecast 2021-2026 ($ million)
- Exhibit 80: Chart on South Korea – Year-over-year growth 2021-2026 (%)
- Exhibit 81: Data Table on South Korea – Year-over-year growth 2021-2026 (%)
- 7.13 Market opportunity by geography
- Exhibit 82: Market opportunity by geography ($ million)
8 Drivers, Challenges, and Trends
- 8.1 Market drivers
- 8.2 Market challenges
- 8.3 Impact of drivers and challenges
- Exhibit 83: Impact of drivers and challenges in 2021 and 2026
- 8.4 Market trends
9 Vendor Landscape
- 9.1 Overview
- 9.2 Vendor landscape
- Exhibit 84: Overview on Criticality of inputs and Factors of differentiation
- 9.3 Landscape disruption
- Exhibit 85: Overview on factors of disruption
- 9.4 Industry risks
- Exhibit 86: Impact of key risks on business
10 Vendor Analysis
- 10.1 Vendors covered
- Exhibit 87: Vendors covered
- 10.2 Market positioning of vendors
- Exhibit 88: Matrix on vendor position and classification
- 10.3 Advanced Voice Recognition Systems Inc.
- Exhibit 89: Advanced Voice Recognition Systems Inc. – Overview
- Exhibit 90: Advanced Voice Recognition Systems Inc. – Product / Service
- Exhibit 91: Advanced Voice Recognition Systems Inc. – Key offerings
- 10.4 Alphabet Inc.
- Exhibit 92: Alphabet Inc. – Overview
- Exhibit 93: Alphabet Inc. – Business segments
- Exhibit 94: Alphabet Inc. – Key news
- Exhibit 95: Alphabet Inc. – Key offerings
- Exhibit 96: Alphabet Inc. – Segment focus
- 10.5 Amazon.com Inc.
- Exhibit 97: Amazon.com Inc. – Overview
- Exhibit 98: Amazon.com Inc. – Business segments
- Exhibit 99: Amazon.com Inc. – Key news
- Exhibit 100: Amazon.com Inc. – Key offerings
- Exhibit 101: Amazon.com Inc. – Segment focus
- 10.6 Apple Inc.
- Exhibit 102: Apple Inc. – Overview
- Exhibit 103: Apple Inc. – Business segments
- Exhibit 104: Apple Inc. – Key news
- Exhibit 105: Apple Inc. – Key offerings
- Exhibit 106: Apple Inc. – Segment focus
- 10.7 Baidu Inc.
- Exhibit 107: Baidu Inc. – Overview
- Exhibit 108: Baidu Inc. – Business segments
- Exhibit 109: Baidu Inc. – Key offerings
- Exhibit 110: Baidu Inc. – Segment focus
- 10.8 CastleOS Software LLC
- Exhibit 111: CastleOS Software LLC – Overview
- Exhibit 112: CastleOS Software LLC – Product / Service
- Exhibit 113: CastleOS Software LLC – Key offerings
- 10.9 Microsoft Corp.
- Exhibit 114: Microsoft Corp. – Overview
- Exhibit 115: Microsoft Corp. – Business segments
- Exhibit 116: Microsoft Corp. – Key news
- Exhibit 117: Microsoft Corp. – Key offerings
- Exhibit 118: Microsoft Corp. – Segment focus
- 10.10 Samsung Electronics Co. Ltd.
- Exhibit 119: Samsung Electronics Co. Ltd. – Overview
- Exhibit 120: Samsung Electronics Co. Ltd. – Business segments
- Exhibit 121: Samsung Electronics Co. Ltd. – Key news
- Exhibit 122: Samsung Electronics Co. Ltd. – Key offerings
- Exhibit 123: Samsung Electronics Co. Ltd. – Segment focus
- 10.11 Sonos Inc.
- Exhibit 124: Sonos Inc. – Overview
- Exhibit 125: Sonos Inc. – Product / Service
- Exhibit 126: Sonos Inc. – Key offerings
- 10.12 SoundHound Inc.
- Exhibit 127: SoundHound Inc. – Overview
- Exhibit 128: SoundHound Inc. – Key offerings
11 Appendix
- 11.1 Scope of the report
- 11.2 Inclusions and exclusions checklist
- Exhibit 129: Inclusions checklist
- Exhibit 130: Exclusions checklist
- 11.3 Currency conversion rates for US$
- Exhibit 131: Currency conversion rates for US$
- 11.4 Research methodology
- Exhibit 132: Research methodology
- Exhibit 133: Validation techniques employed for market sizing
- Exhibit 134: Information sources
- 11.5 List of abbreviations
- Exhibit 135: List of abbreviations
About Us
Technavio is a leading global technology research and advisory company. Their research and analysis focus on emerging market trends and provide actionable insights to help businesses identify market opportunities and develop effective strategies to optimize their market positions. With over 500 specialized analysts, Technavio’s report library consists of more than 17,000 reports and counting, covering 800 technologies, spanning across 50 countries. Their client base consists of enterprises of all sizes, including more than 100 Fortune 500 companies. This growing client base relies on Technavio’s comprehensive coverage, extensive research, and actionable market insights to identify opportunities in existing and potential markets and assess their competitive positions within changing market scenarios.
Contact
Technavio Research
Jesse Maida
Media & Marketing Executive
US: +1 844 364 1100
UK: +44 203 893 3200
Email: media@technavio.com
Website: www.technavio.com
![]()
![]() View original content to download multimedia:https://www.prnewswire.com/news-releases/voice-user-interface-market-size-to-grow-by-usd-29-02-billion–north-america-to-register-maximum-growth–technavio-301552912.html
View original content to download multimedia:https://www.prnewswire.com/news-releases/voice-user-interface-market-size-to-grow-by-usd-29-02-billion–north-america-to-register-maximum-growth–technavio-301552912.html
SOURCE Technavio

Source link
The content is by PR Newswire. Headlines of Today Media is not responsible for the content provided or any links related to this content. Headlines of Today Media is not responsible for the correctness, topicality or the quality of the content.