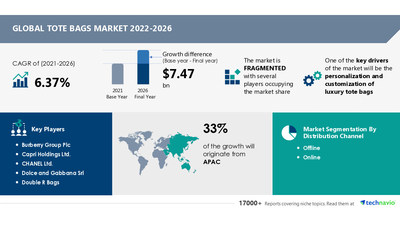
NEW YORK, July 5, 2022 /PRNewswire/ — The tote bags market is set to grow by USD 7.47 billion from 2021 to 2026 as per the latest market report by Technavio. The report projects the market to progress at a CAGR of 6.37%. The tote bags market share growth by the offline segment will be significant for revenue generation. The growing retail industry and the establishment of multiple retail outlets are driving sales in this segment. These outlets offer consumers a variety of tote bags to choose from and provide them with the convenience of finding everything under a single roof. Factors such as discounted prices, a comfortable shopping experience, and attractive shelf displays encourage consumers to buy varied types of leather handbags based on type, brand, and quality. Thus, the considerable growth in retail channels by vendors operating in the market across the globe will drive consumer familiarization with different types of tote bags and increase the sales of tote bags globally during the forecast period.

To know the contribution of each segment – Request a Sample Report
Tote Bags Market: Major Driver
The personalization and customization of luxury tote bags are one of the key drivers supporting the tote bags market growth. In the luxury segment, leading market players offer customized and personalized products to grow the aesthetic appeal of their offerings. The extent of customization and personalization can vary from the strap and buckles to embroidery or the inclusion of a name tag. Customization allows buyers to personalize their tote bags, which makes them more expensive than standard products. A rise in the customization and personalization of tote bags globally complements market growth due to the high price of these bags and through new purchases. This is expected to propel the value sales of the global tote bags market during the forecast period.
To know about the other drivers along with the market challenges – Grab a sample now!
The market research report segments the tote bags market by Distribution Channel (offline and online) and Geography (Europe, APAC, North America, Middle East, and Africa, and South America).
- Regional Analysis: 33% of the market’s growth will originate from APAC during the forecast period. China and Japan and Germany are the key markets for the tote bags market in APAC. Market growth in this region will be faster than the growth of the market in other regions. Growing urbanization will facilitate the tote bags market growth in APAC over the forecast period.
- For more highlights on the regional analysis – Click Now!
Get ready to achieve excellent business outcomes from this exclusive Tote Bags Market report by Technavio. The report will include highlights of the overall market which includes frequently asked questions such as –
- What are historical revenue figures and estimated revenue figures as well as CAGR during the forecast timeframe?
- What is the current trend taking place in the market space?
- Which are business tactics that will influence competitive scenarios along with defining the growth potential of the market?
- What are market drivers, restraints, and challenges impacting demand & growth of the market?
- Which regions & segments will garner massive revenue and emerge as market leaders in upcoming years?
The competitive scenario provided in the Tote Bags Market report analyzes, evaluates, and positions companies based on various performance indicators. Some of the factors considered for this analysis include the financial performance of companies over the past few years, growth strategies, product innovations, new product launches, investments, growth in market share, etc. Don’t wait, Make a strategic approach & boost your business goals with our Tote Bags Market Forecast Report – Buy Now!
- The luxury handbags market share is expected to increase by USD 16.90 billion from 2020 to 2025, and the market’s growth momentum will accelerate at a CAGR of 5.60%.
- The leather handbags market share is expected to increase by USD 8.28 billion from 2020 to 2025, and the market’s growth momentum will accelerate at a CAGR of 5%.
|
Tote Bags Market Scope |
|
|
Report Coverage |
Details |
|
Page number |
120 |
|
Base year |
2021 |
|
Forecast period |
2022-2026 |
|
Growth momentum & CAGR |
Accelerate at a CAGR of 6.37% |
|
Market growth 2022-2026 |
USD 7.47 billion |
|
Market structure |
Fragmented |
|
YoY growth (%) |
5.29 |
|
Performing market contribution |
APAC at 33% |
|
Competitive landscape |
Leading companies, competitive strategies, consumer engagement scope |
|
Companies profiled |
Burberry Group Plc, Capri Holdings Ltd., CHANEL Ltd., Dolce and Gabbana Srl, Double R Bags, Giorgio Armani Spa, Hermes International SA, Kering SA, LVMH Moet Hennessy Louis Vuitton SE, Mulberry Group Plc, PRADA Group, PVH Corp., Ralph Lauren Corp., Ronak Industries, Samsonite International SA, Tapestry Inc., Targus Inc., Tods Spa, VF Corp., and VIP Industries Ltd. |
|
Market Dynamics |
Parent market analysis, Market growth inducers and obstacles, Fast-growing and slow-growing segment analysis, COVID 19 impact and future consumer dynamics, market condition analysis for forecast period, |
|
Customization purview |
If our report has not included the data that you are looking for, you can reach out to our analysts and get segments customized. |
1 Executive Summary
- 1.1 Market overview
- Exhibit 01: Executive Summary – Chart on Market Overview
- Exhibit 02: Executive Summary – Data Table on Market Overview
- Exhibit 03: Executive Summary – Chart on Global Market Characteristics
- Exhibit 04: Executive Summary – Chart on Market by Geography
- Exhibit 05: Executive Summary – Chart on Market Segmentation by Distribution Channel
- Exhibit 06: Executive Summary – Chart on Incremental Growth
- Exhibit 07: Executive Summary – Data Table on Incremental Growth
- Exhibit 08: Executive Summary – Chart on Vendor Market Positioning
2 Market Landscape
- 2.1 Market ecosystem
- Exhibit 09: Parent market
- Exhibit 10: Market Characteristics
3 Market Sizing
- 3.1 Market definition
- Exhibit 11: Offerings of vendors included in the market definition
- 3.2 Market segment analysis
- Exhibit 12: Market segments
- 3.3 Market size 2021
- 3.4 Market outlook: Forecast for 2021-2026
- Exhibit 13: Chart on Global – Market size and forecast 2021-2026 ($ million)
- Exhibit 14: Data Table on Global – Market size and forecast 2021-2026 ($ million)
- Exhibit 15: Chart on Global Market: Year-over-year growth 2021-2026 (%)
- Exhibit 16: Data Table on Global Market: Year-over-year growth 2021-2026 (%)
4 Five Forces Analysis
- 4.1 Five forces summary
- Exhibit 17: Five forces analysis – Comparison between2021 and 2026
- 4.2 Bargaining power of buyers
- Exhibit 18: Chart on Bargaining power of buyers – Impact of key factors 2021 and 2026
- 4.3 Bargaining power of suppliers
- Exhibit 19: Bargaining power of suppliers – Impact of key factors in 2021 and 2026
- 4.4 Threat of new entrants
- Exhibit 20: Threat of new entrants – Impact of key factors in 2021 and 2026
- 4.5 Threat of substitutes
- Exhibit 21: Threat of substitutes – Impact of key factors in 2021 and 2026
- 4.6 Threat of rivalry
- Exhibit 22: Threat of rivalry – Impact of key factors in 2021 and 2026
- 4.7 Market condition
- Exhibit 23: Chart on Market condition – Five forces 2021 and 2026
5 Market Segmentation by Distribution Channel
- 5.1 Market segments
- Exhibit 24: Chart on Distribution Channel – Market share 2021-2026 (%)
- Exhibit 25: Data Table on Distribution Channel – Market share 2021-2026 (%)
- 5.2 Comparison by Distribution Channel
- Exhibit 26: Chart on Comparison by Distribution Channel
- Exhibit 27: Data Table on Comparison by Distribution Channel
- 5.3 Offline – Market size and forecast 2021-2026
- Exhibit 28: Chart on Offline – Market size and forecast 2021-2026 ($ million)
- Exhibit 29: Data Table on Offline – Market size and forecast 2021-2026 ($ million)
- Exhibit 30: Chart on Offline – Year-over-year growth 2021-2026 (%)
- Exhibit 31: Data Table on Offline – Year-over-year growth 2021-2026 (%)
- 5.4 Online – Market size and forecast 2021-2026
- Exhibit 32: Chart on Online – Market size and forecast 2021-2026 ($ million)
- Exhibit 33: Data Table on Online – Market size and forecast 2021-2026 ($ million)
- Exhibit 34: Chart on Online – Year-over-year growth 2021-2026 (%)
- Exhibit 35: Data Table on Online – Year-over-year growth 2021-2026 (%)
- 5.5 Market opportunity by Distribution Channel
- Exhibit 36: Market opportunity by Distribution Channel ($ million)
6 Customer Landscape
- 6.1 Customer landscape overview
- Exhibit 37: Analysis of price sensitivity, lifecycle, customer purchase basket, adoption rates, and purchase criteria
7 Geographic Landscape
- 7.1 Geographic segmentation
- Exhibit 38: Chart on Market share by geography 2021-2026 (%)
- Exhibit 39: Data Table on Market share by geography 2021-2026 (%)
- 7.2 Geographic comparison
- Exhibit 40: Chart on Geographic comparison
- Exhibit 41: Data Table on Geographic comparison
- 7.3 Europe – Market size and forecast 2021-2026
- Exhibit 42: Chart on Europe – Market size and forecast 2021-2026 ($ million)
- Exhibit 43: Data Table on Europe – Market size and forecast 2021-2026 ($ million)
- Exhibit 44: Chart on Europe – Year-over-year growth 2021-2026 (%)
- Exhibit 45: Data Table on Europe – Year-over-year growth 2021-2026 (%)
- 7.4 APAC – Market size and forecast 2021-2026
- Exhibit 46: Chart on APAC – Market size and forecast 2021-2026 ($ million)
- Exhibit 47: Data Table on APAC – Market size and forecast 2021-2026 ($ million)
- Exhibit 48: Chart on APAC – Year-over-year growth 2021-2026 (%)
- Exhibit 49: Data Table on APAC – Year-over-year growth 2021-2026 (%)
- 7.5 North America – Market size and forecast 2021-2026
- Exhibit 50: Chart on North America – Market size and forecast 2021-2026 ($ million)
- Exhibit 51: Data Table on North America – Market size and forecast 2021-2026 ($ million)
- Exhibit 52: Chart on North America – Year-over-year growth 2021-2026 (%)
- Exhibit 53: Data Table on North America – Year-over-year growth 2021-2026 (%)
- 7.6 Middle East and Africa – Market size and forecast 2021-2026
- Exhibit 54: Chart on Middle East and Africa – Market size and forecast 2021-2026 ($ million)
- Exhibit 55: Data Table on Middle East and Africa – Market size and forecast 2021-2026 ($ million)
- Exhibit 56: Chart on Middle East and Africa – Year-over-year growth 2021-2026 (%)
- Exhibit 57: Data Table on Middle East and Africa – Year-over-year growth 2021-2026 (%)
- 7.7 South America – Market size and forecast 2021-2026
- Exhibit 58: Chart on South America – Market size and forecast 2021-2026 ($ million)
- Exhibit 59: Data Table on South America – Market size and forecast 2021-2026 ($ million)
- Exhibit 60: Chart on South America – Year-over-year growth 2021-2026 (%)
- Exhibit 61: Data Table on South America – Year-over-year growth 2021-2026 (%)
- 7.8 US – Market size and forecast 2021-2026
- Exhibit 62: Chart on US – Market size and forecast 2021-2026 ($ million)
- Exhibit 63: Data Table on US – Market size and forecast 2021-2026 ($ million)
- Exhibit 64: Chart on US – Year-over-year growth 2021-2026 (%)
- Exhibit 65: Data Table on US – Year-over-year growth 2021-2026 (%)
- 7.9 China – Market size and forecast 2021-2026
- Exhibit 66: Chart on China – Market size and forecast 2021-2026 ($ million)
- Exhibit 67: Data Table on China – Market size and forecast 2021-2026 ($ million)
- Exhibit 68: Chart on China – Year-over-year growth 2021-2026 (%)
- Exhibit 69: Data Table on China – Year-over-year growth 2021-2026 (%)
- 7.10 France – Market size and forecast 2021-2026
- Exhibit 70: Chart on France – Market size and forecast 2021-2026 ($ million)
- Exhibit 71: Data Table on France – Market size and forecast 2021-2026 ($ million)
- Exhibit 72: Chart on France – Year-over-year growth 2021-2026 (%)
- Exhibit 73: Data Table on France – Year-over-year growth 2021-2026 (%)
- 7.11 UK – Market size and forecast 2021-2026
- Exhibit 74: Chart on UK – Market size and forecast 2021-2026 ($ million)
- Exhibit 75: Data Table on UK – Market size and forecast 2021-2026 ($ million)
- Exhibit 76: Chart on UK – Year-over-year growth 2021-2026 (%)
- Exhibit 77: Data Table on UK – Year-over-year growth 2021-2026 (%)
- 7.12 Germany – Market size and forecast 2021-2026
- Exhibit 78: Chart on Germany – Market size and forecast 2021-2026 ($ million)
- Exhibit 79: Data Table on Germany – Market size and forecast 2021-2026 ($ million)
- Exhibit 80: Chart on Germany – Year-over-year growth 2021-2026 (%)
- Exhibit 81: Data Table on Germany – Year-over-year growth 2021-2026 (%)
- 7.13 Japan – Market size and forecast 2021-2026
- Exhibit 82: Chart on Japan – Market size and forecast 2021-2026 ($ million)
- Exhibit 83: Data Table on Japan – Market size and forecast 2021-2026 ($ million)
- Exhibit 84: Chart on Japan – Year-over-year growth 2021-2026 (%)
- Exhibit 85: Data Table on Japan – Year-over-year growth 2021-2026 (%)
- 7.14 Market opportunity by geography
- Exhibit 86: Market opportunity by geography ($ million)
8 Drivers, Challenges, and Trends
- 8.1 Market drivers
- 8.2 Market challenges
- 8.3 Impact of drivers and challenges
- Exhibit 87: Impact of drivers and challenges in 2021 and 2026
- 8.4 Market trends
9 Vendor Landscape
- 9.1 Overview
- 9.2 Vendor landscape
- Exhibit 88: Overview on Criticality of inputs and Factors of differentiation
- 9.3 Landscape disruption
- Exhibit 89: Overview on factors of disruption
- 9.4 Industry risks
- Exhibit 90: Impact of key risks on business
10 Vendor Analysis
- 10.1 Vendors covered
- Exhibit 91: Vendors covered
- 10.2 Market positioning of vendors
- Exhibit 92: Matrix on vendor position and classification
- 10.3 Burberry Group Plc
- Exhibit 93: Burberry Group Plc – Overview
- Exhibit 94: Burberry Group Plc – Business segments
- Exhibit 95: Burberry Group Plc – Key offerings
- Exhibit 96: Burberry Group Plc – Segment focus
- 10.4 Capri Holdings Ltd.
- Exhibit 97: Capri Holdings Ltd. – Overview
- Exhibit 98: Capri Holdings Ltd. – Business segments
- Exhibit 99: Capri Holdings Ltd. – Key news
- Exhibit 100: Capri Holdings Ltd. – Key offerings
- Exhibit 101: Capri Holdings Ltd. – Segment focus
- 10.5 CHANEL Ltd.
- Exhibit 102: CHANEL Ltd. – Overview
- Exhibit 103: CHANEL Ltd. – Business segments
- Exhibit 104: CHANEL Ltd. – Key offerings
- Exhibit 105: CHANEL Ltd. – Segment focus
- 10.6 Kering SA
- Exhibit 106: Kering SA – Overview
- Exhibit 107: Kering SA – Business segments
- Exhibit 108: Kering SA – Key offerings
- Exhibit 109: Kering SA – Segment focus
- 10.7 LVMH Moet Hennessy Louis Vuitton SE
- Exhibit 110: LVMH Moet Hennessy Louis Vuitton SE – Overview
- Exhibit 111: LVMH Moet Hennessy Louis Vuitton SE – Business segments
- Exhibit 112: LVMH Moet Hennessy Louis Vuitton SE – Key news
- Exhibit 113: LVMH Moet Hennessy Louis Vuitton SE – Key offerings
- Exhibit 114: LVMH Moet Hennessy Louis Vuitton SE – Segment focus
- 10.8 PRADA Group
- Exhibit 115: PRADA Group – Overview
- Exhibit 116: PRADA Group – Product / Service
- Exhibit 117: PRADA Group – Key offerings
- 10.9 PVH Corp.
- Exhibit 118: PVH Corp. – Overview
- Exhibit 119: PVH Corp. – Business segments
- Exhibit 120: PVH Corp. – Key offerings
- Exhibit 121: PVH Corp. – Segment focus
- 10.10 Samsonite International SA
- Exhibit 122: Samsonite International SA – Overview
- Exhibit 123: Samsonite International SA – Business segments
- Exhibit 124: Samsonite International SA – Key offerings
- Exhibit 125: Samsonite International SA – Segment focus
- 10.11 Tapestry Inc.
- Exhibit 126: Tapestry Inc. – Overview
- Exhibit 127: Tapestry Inc. – Business segments
- Exhibit 128: Tapestry Inc. – Key offerings
- Exhibit 129: Tapestry Inc. – Segment focus
- 10.12 VF Corp.
- Exhibit 130: VF Corp. – Overview
- Exhibit 131: VF Corp. – Business segments
- Exhibit 132: VF Corp. – Key news
- Exhibit 133: VF Corp. – Key offerings
- Exhibit 134: VF Corp. – Segment focus
11 Appendix
- 11.1 Scope of the report
- 11.2 Inclusions and exclusions checklist
- Exhibit 135: Inclusions checklist
- Exhibit 136: Exclusions checklist
- 11.3 Currency conversion rates for US$
- Exhibit 137: Currency conversion rates for US$
- 11.4 Research methodology
- Exhibit 138: Research methodology
- Exhibit 139: Validation techniques employed for market sizing
- Exhibit 140: Information sources
- 11.5 List of abbreviations
- Exhibit 141: List of abbreviations
Technavio is a leading global technology research and advisory company. Their research and analysis focuses on emerging market trends and provides actionable insights to help businesses identify market opportunities and develop effective strategies to optimize their market positions.
With over 500 specialized analysts, Technavio’s report library consists of more than 17,000 reports and counting, covering 800 technologies, spanning across 50 countries. Their client base consists of enterprises of all sizes, including more than 100 Fortune 500 companies. This growing client base relies on Technavio’s comprehensive coverage, extensive research, and actionable market insights to identify opportunities in existing and potential markets and assess their competitive positions within changing market scenarios.
Technavio Research
Jesse Maida
Media & Marketing Executive
US: +1 844 364 1100
UK: +44 203 893 3200
Email: media@technavio.com
Website: www.technavio.com/
![]()
![]() View original content to download multimedia:https://www.prnewswire.com/news-releases/tote-bags-market-to-record-5-29-y-o-y-growth-rate-in-2022–offline-segment-to-be-significant-for-revenue-generation–technavio-301580466.html
View original content to download multimedia:https://www.prnewswire.com/news-releases/tote-bags-market-to-record-5-29-y-o-y-growth-rate-in-2022–offline-segment-to-be-significant-for-revenue-generation–technavio-301580466.html
SOURCE Technavio

Source link
The content is by PR Newswire. Headlines of Today Media is not responsible for the content provided or any links related to this content. Headlines of Today Media is not responsible for the correctness, topicality or the quality of the content.