NEW YORK, Aug. 3, 2022 /PRNewswire/ — Silver iodide is a fast ion conductor and an inorganic chemical compound that is highly insoluble in water. It is frequently used in photography, as an antiseptic in medicine, and in other applications. Silver iodide’s crystalline structure changes with temperature.

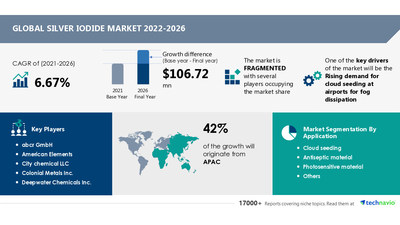
The silver iodide market size is expected to grow by USD 106.72 million from 2021 to 2026. In addition, the growth momentum of the market will accelerate at a CAGR of 6.67% during the forecast period.
Make confident decisions using the benchmarks and analysis of Technavio. Download Free Sample Report
Silver Iodide Market Application Outlook (Revenue, USD mn, 2021-2026)
- Cloud seeding – size and forecast 2021-2026
- Antiseptic material – size and forecast 2021-2026
- Photosensitive material – size and forecast 2021-2026
- Others – size and forecast 2021-2026
Silver Iodide Market Geography Outlook (Revenue, USD mn, 2021-2026)
- APAC – size and forecast 2021-2026
- North America – size and forecast 2021-2026
- Europe – size and forecast 2021-2026
- Middle East and Africa – size and forecast 2021-2026
- South America – size and forecast 2021-2026
Learn about the contribution of each segment summarized in concise infographics and thorough descriptions. View a Free Sample Report
APAC will contribute the highest market share growth during the forecast period. The region is expected to account for 42% of the market’s growth. This growth is attributed to factors such as the increasing demand for water from farmers. Moreover, market growth in this region will be faster than the growth of the market in other regions. China and Japan are the key countries in the silver iodide market in APAC.
abcr GmbH, American Elements, City chemical LLC, Colonial Metals Inc., Deepwater Chemicals Inc., ESPI Metals, Hanhong Pharmaceutical Technology Co. Ltd., Infinium Pharmachem Pvt. Ltd., Iofina Plc, Micron Platers, Otto Chemie Pvt. Ltd., Thermo Fisher Scientific Inc., Vizag Chemical International, and Wuhan Silworld Chemical Co. Ltd. are some of the main players in the market. The key offerings of a few of these vendors are listed below:
- City chemical LLC – The company offers core banking solutions for managing treasury management, capital and money market management, limits management and corporate loans, and risk management.
- Colonial Metals Inc. – The company offers core banking solutions with intuitive navigation and customer-centric design that combines proven banking functionality with modern architecture and experience.
- Deepwater Chemicals Inc. – The company offers core banking solutions that can integrate with third-party vendors enabling transformational banking, thus driving improvements and innovation across the business.
- ESPI Metals – The company offers core banking solutions for next-generation digital banking and payments solutions that deliver great experiences for customers.
- Infinium Pharmachem Pvt. Ltd. – The company offers core banking solutions with a comprehensive suite of capabilities to power digital transformation.
The rising demand for cloud seeding at airports for fog dissipation is driving the growth of the market. The aviation industry uses cloud seeding to maintain normal weather conditions around runways, as an aircraft’s ability to take off or land can be hindered due to fog, hail, or ice.
Altered weather patterns in other areas are challenging the market. When clouds are injected with cloud seeds, it leads to more rainfall in a specific place, which can hamper other areas of precipitation processes. Such inconvenience may impede the silver iodide market growth during the forecast period.
Silver Nitrate Market by Application and Geography – Forecast and Analysis 2021-2025
Mining Chemicals Market in North America by Application and Geography – Forecast and Analysis 2022-2026
|
Silver Iodide Market Scope |
|
|
Report Coverage |
Details |
|
Page number |
120 |
|
Base year |
2021 |
|
Forecast period |
2022-2026 |
|
Growth momentum & CAGR |
Accelerate at a CAGR of 6.67% |
|
Market growth 2022-2026 |
USD 106.72 million |
|
Market structure |
Fragmented |
|
YoY growth (%) |
6.32 |
|
Regional analysis |
APAC, North America, Europe, Middle East and Africa, and South America |
|
Performing market contribution |
APAC at 42% |
|
Key consumer countries |
US, Canada, China, Japan, UK, and Germany |
|
Competitive landscape |
Leading companies, Competitive strategies, Consumer engagement scope |
|
Key companies profiled |
abcr GmbH, American Elements, City chemical LLC, Colonial Metals Inc., Deepwater Chemicals Inc., ESPI Metals, Hanhong Pharmaceutical Technology Co. Ltd., Infinium Pharmachem Pvt. Ltd., Iofina Plc, Micron Platers, Otto Chemie Pvt. Ltd., Thermo Fisher Scientific Inc., Vizag Chemical International, and Wuhan Silworld Chemical Co. Ltd. |
|
Market dynamics |
Parent market analysis, market growth inducers and obstacles, fast-growing and slow-growing segment analysis, COVID-19 impact and recovery analysis and future consumer dynamics, Market condition analysis for forecast period |
|
Customization purview |
If our report has not included the data that you are looking for, you can reach out to our analysts and get segments customized. |
1 Executive Summary
- 1.1 Market overview
- Exhibit 01: Executive Summary – Chart on Market Overview
- Exhibit 02: Executive Summary – Data Table on Market Overview
- Exhibit 03: Executive Summary – Chart on Global Market Characteristics
- Exhibit 04: Executive Summary – Chart on Market by Geography
- Exhibit 05: Executive Summary – Chart on Market Segmentation by Application
- Exhibit 06: Executive Summary – Chart on Incremental Growth
- Exhibit 07: Executive Summary – Data Table on Incremental Growth
- Exhibit 08: Executive Summary – Chart on Vendor Market Positioning
2 Market Landscape
- 2.1 Market ecosystem
- Exhibit 09: Parent market
- Exhibit 10: Market Characteristics
3 Market Sizing
- 3.1 Market definition
- Exhibit 11: Offerings of vendors included in the market definition
- 3.2 Market segment analysis
- Exhibit 12: Market segments
- 3.3 Market size 2021
- 3.4 Market outlook: Forecast for 2021-2026
- Exhibit 13: Chart on Global – Market size and forecast 2021-2026 ($ million)
- Exhibit 14: Data Table on Global – Market size and forecast 2021-2026 ($ million)
- Exhibit 15: Chart on Global Market: Year-over-year growth 2021-2026 (%)
- Exhibit 16: Data Table on Global Market: Year-over-year growth 2021-2026 (%)
4 Five Forces Analysis
- 4.1 Five forces summary
- Exhibit 17: Five forces analysis – Comparison between 2021 and 2026
- 4.2 Bargaining power of buyers
- Exhibit 18: Chart on Bargaining power of buyers – Impact of key factors 2021 and 2026
- 4.3 Bargaining power of suppliers
- Exhibit 19: Bargaining power of suppliers – Impact of key factors in 2021 and 2026
- 4.4 Threat of new entrants
- Exhibit 20: Threat of new entrants – Impact of key factors in 2021 and 2026
- 4.5 Threat of substitutes
- Exhibit 21: Threat of substitutes – Impact of key factors in 2021 and 2026
- 4.6 Threat of rivalry
- Exhibit 22: Threat of rivalry – Impact of key factors in 2021 and 2026
- 4.7 Market condition
- Exhibit 23: Chart on Market condition – Five forces 2021 and 2026
5 Market Segmentation by Application
- 5.1 Market segments
- Exhibit 24: Chart on Application – Market share 2021-2026 (%)
- Exhibit 25: Data Table on Application – Market share 2021-2026 (%)
- 5.2 Comparison by Application
- Exhibit 26: Chart on Comparison by Application
- Exhibit 27: Data Table on Comparison by Application
- 5.3 Cloud seeding – Market size and forecast 2021-2026
- Exhibit 28: Chart on Cloud seeding – Market size and forecast 2021-2026 ($ million)
- Exhibit 29: Data Table on Cloud seeding – Market size and forecast 2021-2026 ($ million)
- Exhibit 30: Chart on Cloud seeding – Year-over-year growth 2021-2026 (%)
- Exhibit 31: Data Table on Cloud seeding – Year-over-year growth 2021-2026 (%)
- 5.4 Antiseptic material – Market size and forecast 2021-2026
- Exhibit 32: Chart on Antiseptic material – Market size and forecast 2021-2026 ($ million)
- Exhibit 33: Data Table on Antiseptic material – Market size and forecast 2021-2026 ($ million)
- Exhibit 34: Chart on Antiseptic material – Year-over-year growth 2021-2026 (%)
- Exhibit 35: Data Table on Antiseptic material – Year-over-year growth 2021-2026 (%)
- 5.5 Photosensitive material – Market size and forecast 2021-2026
- Exhibit 36: Chart on Photosensitive material – Market size and forecast 2021-2026 ($ million)
- Exhibit 37: Data Table on Photosensitive material – Market size and forecast 2021-2026 ($ million)
- Exhibit 38: Chart on Photosensitive material – Year-over-year growth 2021-2026 (%)
- Exhibit 39: Data Table on Photosensitive material – Year-over-year growth 2021-2026 (%)
- 5.6 Others – Market size and forecast 2021-2026
- Exhibit 40: Chart on Others – Market size and forecast 2021-2026 ($ million)
- Exhibit 41: Data Table on Others – Market size and forecast 2021-2026 ($ million)
- Exhibit 42: Chart on Others – Year-over-year growth 2021-2026 (%)
- Exhibit 43: Data Table on Others – Year-over-year growth 2021-2026 (%)
- 5.7 Market opportunity by Application
- Exhibit 44: Market opportunity by Application ($ million)
6 Customer Landscape
- 6.1 Customer landscape overview
- Exhibit 45: Analysis of price sensitivity, lifecycle, customer purchase basket, adoption rates, and purchase criteria
7 Geographic Landscape
- 7.1 Geographic segmentation
- Exhibit 46: Chart on Market share by geography 2021-2026 (%)
- Exhibit 47: Data Table on Market share by geography 2021-2026 (%)
- 7.2 Geographic comparison
- Exhibit 48: Chart on Geographic comparison
- Exhibit 49: Data Table on Geographic comparison
- 7.3 APAC – Market size and forecast 2021-2026
- Exhibit 50: Chart on APAC – Market size and forecast 2021-2026 ($ million)
- Exhibit 51: Data Table on APAC – Market size and forecast 2021-2026 ($ million)
- Exhibit 52: Chart on APAC – Year-over-year growth 2021-2026 (%)
- Exhibit 53: Data Table on APAC – Year-over-year growth 2021-2026 (%)
- 7.4 North America – Market size and forecast 2021-2026
- Exhibit 54: Chart on North America – Market size and forecast 2021-2026 ($ million)
- Exhibit 55: Data Table on North America – Market size and forecast 2021-2026 ($ million)
- Exhibit 56: Chart on North America – Year-over-year growth 2021-2026 (%)
- Exhibit 57: Data Table on North America – Year-over-year growth 2021-2026 (%)
- 7.5 Europe – Market size and forecast 2021-2026
- Exhibit 58: Chart on Europe – Market size and forecast 2021-2026 ($ million)
- Exhibit 59: Data Table on Europe – Market size and forecast 2021-2026 ($ million)
- Exhibit 60: Chart on Europe – Year-over-year growth 2021-2026 (%)
- Exhibit 61: Data Table on Europe – Year-over-year growth 2021-2026 (%)
- 7.6 Middle East and Africa – Market size and forecast 2021-2026
- Exhibit 62: Chart on Middle East and Africa – Market size and forecast 2021-2026 ($ million)
- Exhibit 63: Data Table on Middle East and Africa – Market size and forecast 2021-2026 ($ million)
- Exhibit 64: Chart on Middle East and Africa – Year-over-year growth 2021-2026 (%)
- Exhibit 65: Data Table on Middle East and Africa – Year-over-year growth 2021-2026 (%)
- 7.7 South America – Market size and forecast 2021-2026
- Exhibit 66: Chart on South America – Market size and forecast 2021-2026 ($ million)
- Exhibit 67: Data Table on South America – Market size and forecast 2021-2026 ($ million)
- Exhibit 68: Chart on South America – Year-over-year growth 2021-2026 (%)
- Exhibit 69: Data Table on South America – Year-over-year growth 2021-2026 (%)
- 7.8 China – Market size and forecast 2021-2026
- Exhibit 70: Chart on China – Market size and forecast 2021-2026 ($ million)
- Exhibit 71: Data Table on China – Market size and forecast 2021-2026 ($ million)
- Exhibit 72: Chart on China – Year-over-year growth 2021-2026 (%)
- Exhibit 73: Data Table on China – Year-over-year growth 2021-2026 (%)
- 7.9 US – Market size and forecast 2021-2026
- Exhibit 74: Chart on US – Market size and forecast 2021-2026 ($ million)
- Exhibit 75: Data Table on US – Market size and forecast 2021-2026 ($ million)
- Exhibit 76: Chart on US – Year-over-year growth 2021-2026 (%)
- Exhibit 77: Data Table on US – Year-over-year growth 2021-2026 (%)
- 7.10 Japan – Market size and forecast 2021-2026
- Exhibit 78: Chart on Japan – Market size and forecast 2021-2026 ($ million)
- Exhibit 79: Data Table on Japan – Market size and forecast 2021-2026 ($ million)
- Exhibit 80: Chart on Japan – Year-over-year growth 2021-2026 (%)
- Exhibit 81: Data Table on Japan – Year-over-year growth 2021-2026 (%)
- 7.11 Canada – Market size and forecast 2021-2026
- Exhibit 82: Chart on Canada – Market size and forecast 2021-2026 ($ million)
- Exhibit 83: Data Table on Canada – Market size and forecast 2021-2026 ($ million)
- Exhibit 84: Chart on Canada – Year-over-year growth 2021-2026 (%)
- Exhibit 85: Data Table on Canada – Year-over-year growth 2021-2026 (%)
- 7.12 UK – Market size and forecast 2021-2026
- Exhibit 86: Chart on UK – Market size and forecast 2021-2026 ($ million)
- Exhibit 87: Data Table on UK – Market size and forecast 2021-2026 ($ million)
- Exhibit 88: Chart on UK – Year-over-year growth 2021-2026 (%)
- Exhibit 89: Data Table on UK – Year-over-year growth 2021-2026 (%)
- 7.13 Germany – Market size and forecast 2021-2026
- Exhibit 90: Chart on Germany – Market size and forecast 2021-2026 ($ million)
- Exhibit 91: Data Table on Germany – Market size and forecast 2021-2026 ($ million)
- Exhibit 92: Chart on Germany – Year-over-year growth 2021-2026 (%)
- Exhibit 93: Data Table on Germany – Year-over-year growth 2021-2026 (%)
- 7.14 Market opportunity by geography
- Exhibit 94: Market opportunity by geography ($ million)
8 Drivers, Challenges, and Trends
- 8.1 Market drivers
- 8.2 Market challenges
- 8.3 Impact of drivers and challenges
- Exhibit 95: Impact of drivers and challenges in 2021 and 2026
- 8.4 Market trends
9 Vendor Landscape
- 9.1 Overview
- 9.2 Vendor landscape
- Exhibit 96: Overview on Criticality of inputs and Factors of differentiation
- 9.3 Landscape disruption
- Exhibit 97: Overview on factors of disruption
- 9.4 Industry risks
- Exhibit 98: Impact of key risks on business
10 Vendor Analysis
- 10.1 Vendors covered
- Exhibit 99: Vendors covered
- 10.2 Market positioning of vendors
- Exhibit 100: Matrix on vendor position and classification
- 10.3 abcr GmbH
- Exhibit 101: abcr GmbH – Overview
- Exhibit 102: abcr GmbH – Product / Service
- Exhibit 103: abcr GmbH – Key offerings
- 10.4 American Elements
- Exhibit 104: American Elements – Overview
- Exhibit 105: American Elements – Product / Service
- Exhibit 106: American Elements – Key offerings
- 10.5 City chemical LLC
- Exhibit 107: City chemical LLC – Overview
- Exhibit 108: City chemical LLC – Product / Service
- Exhibit 109: City chemical LLC – Key offerings
- 10.6 Colonial Metals Inc.
- Exhibit 110: Colonial Metals Inc. – Overview
- Exhibit 111: Colonial Metals Inc. – Product / Service
- Exhibit 112: Colonial Metals Inc. – Key offerings
- 10.7 Infinium Pharmachem Pvt. Ltd.
- Exhibit 113: Infinium Pharmachem Pvt. Ltd. – Overview
- Exhibit 114: Infinium Pharmachem Pvt. Ltd. – Product / Service
- Exhibit 115: Infinium Pharmachem Pvt. Ltd. – Key offerings
- 10.8 Iofina Plc
- Exhibit 116: Iofina Plc – Overview
- Exhibit 117: Iofina Plc – Product / Service
- Exhibit 118: Iofina Plc – Key offerings
- 10.9 Micron Platers
- Exhibit 119: Micron Platers – Overview
- Exhibit 120: Micron Platers – Product / Service
- Exhibit 121: Micron Platers – Key offerings
- 10.10 Otto Chemie Pvt. Ltd.
- Exhibit 122: Otto Chemie Pvt. Ltd. – Overview
- Exhibit 123: Otto Chemie Pvt. Ltd. – Product / Service
- Exhibit 124: Otto Chemie Pvt. Ltd. – Key offerings
- 10.11 Thermo Fisher Scientific Inc.
- Exhibit 125: Thermo Fisher Scientific Inc. – Overview
- Exhibit 126: Thermo Fisher Scientific Inc. – Business segments
- Exhibit 127: Thermo Fisher Scientific Inc. – Key news
- Exhibit 128: Thermo Fisher Scientific Inc. – Key offerings
- Exhibit 129: Thermo Fisher Scientific Inc. – Segment focus
- 10.12 Vizag Chemical International
- Exhibit 130: Vizag Chemical International – Overview
- Exhibit 131: Vizag Chemical International – Product / Service
- Exhibit 132: Vizag Chemical International – Key offerings
11 Appendix
- 11.1 Scope of the report
- 11.2 Inclusions and exclusions checklist
- Exhibit 133: Inclusions checklist
- Exhibit 134: Exclusions checklist
- 11.3 Currency conversion rates for US$
- Exhibit 135: Currency conversion rates for US$
- 11.4 Research methodology
- Exhibit 136: Research methodology
- Exhibit 137: Validation techniques employed for market sizing
- Exhibit 138: Information sources
- 11.5 List of abbreviations
- Exhibit 139: List of abbreviations
Technavio is a leading global technology research and advisory company. Their research and analysis focus on emerging market trends and provide actionable insights to help businesses identify market opportunities and develop effective strategies to optimize their market positions.
With over 500 specialized analysts, Technavio’s report library consists of more than 17,000 reports and counting, covering 800 technologies, spanning across 50 countries. Their client base consists of enterprises of all sizes, including more than 100 Fortune 500 companies. This growing client base relies on Technavio’s comprehensive coverage, extensive research, and actionable market insights to identify opportunities in existing and potential markets and assess their competitive positions within changing market scenarios.
Technavio Research
Jesse Maida
Media & Marketing Executive
US: +1 844 364 1100
UK: +44 203 893 3200
Email: media@technavio.com
Website: www.technavio.com/
![]()
![]() View original content to download multimedia:https://www.prnewswire.com/news-releases/silver-iodide-market-size-to-grow-by-usd-106-72-million-rising-demand-for-cloud-seeding-at-airports-for-fog-dissipation-to-drive-growth—technavio-301598818.html
View original content to download multimedia:https://www.prnewswire.com/news-releases/silver-iodide-market-size-to-grow-by-usd-106-72-million-rising-demand-for-cloud-seeding-at-airports-for-fog-dissipation-to-drive-growth—technavio-301598818.html
SOURCE Technavio

Source link
The content is by PR Newswire. Headlines of Today Media is not responsible for the content provided or any links related to this content. Headlines of Today Media is not responsible for the correctness, topicality or the quality of the content.