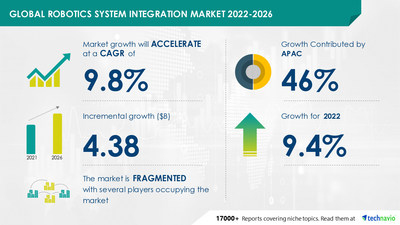
NEW YORK, Aug. 3, 2022 /PRNewswire/ — The Robotics System Integration Market report offers a comprehensive analysis of new product launches, the latest trends, and the post-pandemic impact on businesses. The robotics system integration market value is anticipated to grow by USD 4.38 billion, progressing at a CAGR of 9.8% as per the latest market report by Technavio. 46% of the market’s growth will originate from APAC during the forecast period. China, Japan, and South Korea are the key markets for robotics system integration in APAC. Market growth in this region will be faster than the growth of the market in other regions. Growth in the F&B, pharmaceutical, electrical and electronics, semiconductor, and cosmetics industries will facilitate the robotics system integration market growth in APAC over the forecast period.

For more highlights on the regional segment- Grab a FREE sample now!
The robotics system integration market is fragmented and the vendors are deploying growth strategies such as focusing more on innovation and technological advancements to compete in the market. The robotics system integration market report provides complete insights on key vendors including Amtec Solutions Group Inc., Burke Porter Group, CNC Robotics Ltd., Concept Systems Inc., FH Automation, Geku Automation, Hitachi Ltd., IPG Photonics Corp., JH Robotics Inc., MESH Automation Inc., Midwest Engineered Systems Inc., Mitsui and Co. Ltd., Motion Controls Robotics Inc., Peak Analysis and Automation Ltd., Phoenix Control Systems Ltd., R U Robotics Ltd., RNA Automation Ltd., RobotWorx, TASI Group, and TW Automation.
- Burke Porter Group – The company offers robotic system integration solutions under its brand Van Hoecke Automation
- Concept Systems Inc. – The company offers robotic system integration solutions such as OnGuard Collision Avoidance, OnRobotics, and LengthScan Pro.
- FH Automation – The company offers robotic system integration solutions for vision inspection and traceability.
- Geku Automation – The company offers robotic system integration namely the Robot Automation system for material handling, molding process, and assembly process.
- Hitachi Ltd. – The company offers robotic system integration solutions through its subsidiary JR Automation.
- IPG Photonics Corp. – The company offers robotic system integration solutions through its subsidiary Genesis System Corp.
- To know about the offerings of each vendor – Click Now!
- Drivers –The market is driven by factors such as the increase in demand for cobots, a surge in the industrial robotics industry, and technological innovations in robot system integration.
- Challenges – The high cost of services is hindering market growth.
- Trends – The increase in demand for application-specific industrial robots is a major trend that will open multiple growth opportunities for players in the market.
For elaborated information on the market dynamics – Request a FREE sample now!
- By Application, the market is classified into material handling, welding and soldering, assembly line, and others.
- By Geography, the market is classified as Europe, North America, APAC, South America, and the Middle East and Africa.
To know about the market contribution of each segment – Request a FREE sample!
The competitive scenario provided in the Robotics System Integration Market report analyzes, evaluates, and positions companies based on various performance indicators. Some of the factors considered for this analysis include the financial performance of companies over the past few years, growth strategies, product innovations, new product launches, investments, growth in market share, etc.Don’t wait, Make a strategic approach & boost your business goals with our Robotics System Integration Market Forecast Report – Buy Now!
- The elevator and escalator market share is expected to increase to 275.28 thousand units from 2021 to 2026, and the market’s growth momentum will accelerate at a CAGR of 4.37%.
- The laser cutting machine market share is expected to increase to USD 1.25 billion from 2021 to 2026, at a CAGR of 4.91%.
|
Robotics System Integration Market Scope |
|
|
Report Coverage |
Details |
|
Page number |
120 |
|
Base year |
2021 |
|
Forecast period |
2022-2026 |
|
Growth momentum & CAGR |
Accelerate at a CAGR of 9.8% |
|
Market growth 2022-2026 |
USD 4.38 billion |
|
Market structure |
Fragmented |
|
YoY growth (%) |
9.4 |
|
Regional analysis |
Europe, North America, APAC, South America, the Middle East, and Africa |
|
Performing market contribution |
APAC at 46% |
|
Key consumer countries |
US, China, Japan, South Korea, and Germany |
|
Competitive landscape |
Leading companies, competitive strategies, consumer engagement scope |
|
Companies profiled |
Amtec Solutions Group Inc., Burke Porter Group, CNC Robotics Ltd., Concept Systems Inc., FH Automation, Geku Automation, Hitachi Ltd., IPG Photonics Corp., JH Robotics Inc., MESH Automation Inc., Midwest Engineered Systems Inc., Mitsui and Co. Ltd., Motion Controls Robotics Inc., Peak Analysis and Automation Ltd., Phoenix Control Systems Ltd., R U Robotics Ltd., RNA Automation Ltd., RobotWorx, TASI Group, and TW Automation |
|
Market Dynamics |
Parent market analysis, Market growth inducers and obstacles, Fast-growing and slow-growing segment analysis, COVID 19 impact and future consumer dynamics, and market condition analysis for the forecast period. |
|
Customization purview |
If our report has not included the data you are looking for, you can reach out to our analysts and get customized segments. |
Browse for Technavio “Industrials Market” Research Reports
1 Executive Summary
- 1.1 Market Overview
- Exhibit 01: Executive Summary – Chart on Market Overview
- Exhibit 02: Executive Summary – Data Table on Market Overview
- Exhibit 03: Executive Summary – Chart of Global Market Characteristics
- Exhibit 04: Executive Summary – Chart of Market by Geography
- Exhibit 05: Executive Summary – Chart on Market Segmentation by Application
- Exhibit 06: Executive Summary – Chart on Incremental Growth
- Exhibit 07: Executive Summary – Data Table on Incremental Growth
- Exhibit 08: Executive Summary – Chart on Vendor Market Positioning
2 Market Landscape
- 2.1 Market ecosystem
- Exhibit 09: Parent market
- Exhibit 10: Market Characteristics
3 Market Sizing
- 3.1 Market Definition
- Exhibit 11: Offerings of vendors included in the market definition
- 3.2 Market segment analysis
- Exhibit 12: Market segments
- 3.3 Market size 2021
- 3.4 Market outlook: Forecast for 2021-2026
- Exhibit 13: Chart on Global – Market size and forecast 2021-2026 ($ million)
- Exhibit 14: Data Table on Global – Market size and forecast 2021-2026 ($ million)
- Exhibit 15: Chart on Global Market: Year-over-year growth 2021-2026 (%)
- Exhibit 16: Data Table on Global Market: Year-over-year growth 2021-2026 (%)
4 Five Forces Analysis
- 4.1 Five forces summary
- Exhibit 17: Five forces analysis – Comparison between 2021 and 2026
- 4.2 Bargaining power of buyers
- Exhibit 18: Chart on the Bargaining power of buyers – Impact of key factors 2021 and 2026
- 4.3 Bargaining power of suppliers
- Exhibit 19: Bargaining power of suppliers – Impact of key factors in 2021 and 2026
- 4.4 Threat of new entrants
- Exhibit 20: Threat of new entrants – Impact of key factors in 2021 and 2026
- 4.5 Threat of substitutes
- Exhibit 21: Threat of substitutes – Impact of key factors in 2021 and 2026
- 4.6 Threat of rivalry
- Exhibit 22: Threat of rivalry – Impact of key factors in 2021 and 2026
- 4.7 Market condition
- Exhibit 23: Chart of Market condition – Five forces 2021 and 2026
5 Market Segmentation by Application
- 5.1 Market segments
- Exhibit 24: Chart on Application – Market share 2021-2026 (%)
- Exhibit 25: Data Table on Application – Market share 2021-2026 (%)
- 5.2 Comparison by Application
- Exhibit 26: Chart on Comparison by Application
- Exhibit 27: Data Table on Comparison by Application
- 5.3 Material handling – Market size and forecast 2021-2026
- Exhibit 28: Chart on Material handling – Market size and forecast 2021-2026 ($ million)
- Exhibit 29: Data Table on Material handling – Market size and forecast 2021-2026 ($ million)
- Exhibit 30: Chart on Material handling – Year-over-year growth 2021-2026 (%)
- Exhibit 31: Data Table on Material handling – Year-over-year growth 2021-2026 (%)
- 5.4 Welding and soldering – Market size and forecast 2021-2026
- Exhibit 32: Chart on Welding and soldering – Market size and forecast 2021-2026 ($ million)
- Exhibit 33: Data Table on Welding and soldering – Market size and forecast 2021-2026 ($ million)
- Exhibit 34: Chart on Welding and soldering – Year-over-year growth 2021-2026 (%)
- Exhibit 35: Data Table on Welding and soldering – Year-over-year growth 2021-2026 (%)
- 5.5 Assembly line – Market size and forecast 2021-2026
- Exhibit 36: Chart on Assembly line – Market size and forecast 2021-2026 ($ million)
- Exhibit 37: Data Table on Assembly line – Market size and forecast 2021-2026 ($ million)
- Exhibit 38: Chart on Assembly line – Year-over-year growth 2021-2026 (%)
- Exhibit 39: Data Table on Assembly line – Year-over-year growth 2021-2026 (%)
- 5.6 Others – Market size and forecast 2021-2026
- Exhibit 40: Chart on Others – Market size and forecast 2021-2026 ($ million)
- Exhibit 41: Data Table on Others – Market size and forecast 2021-2026 ($ million)
- Exhibit 42: Chart on Others – Year-over-year growth 2021-2026 (%)
- Exhibit 43: Data Table on Others – Year-over-year growth 2021-2026 (%)
- 5.7 Market opportunity by Application
- Exhibit 44: Market opportunity by Application ($ million)
6 Customer Landscape
- 6.1 Customer landscape overview
- Exhibit 45: Analysis of price sensitivity, lifecycle, customer purchase basket, adoption rates, and purchase criteria
7 Geographic Landscape
- 7.1 Geographic segmentation
- Exhibit 46: Chart on Market share by geography 2021-2026 (%)
- Exhibit 47: Data Table on Market share by geography 2021-2026 (%)
- 7.2 Geographic comparison
- Exhibit 48: Chart on Geographic comparison
- Exhibit 49: Data Table on Geographic comparison
- 7.3 APAC – Market size and forecast 2021-2026
- Exhibit 50: Chart on APAC – Market size and forecast 2021-2026 ($ million)
- Exhibit 51: Data Table on APAC – Market size and forecast 2021-2026 ($ million)
- Exhibit 52: Chart on APAC – Year-over-year growth 2021-2026 (%)
- Exhibit 53: Data Table on APAC – Year-over-year growth 2021-2026 (%)
- 7.4 Europe – Market size and forecast 2021-2026
- Exhibit 54: Chart on Europe – Market size and forecast 2021-2026 ($ million)
- Exhibit 55: Data Table on Europe – Market size and forecast 2021-2026 ($ million)
- Exhibit 56: Chart on Europe – Year-over-year growth 2021-2026 (%)
- Exhibit 57: Data Table on Europe – Year-over-year growth 2021-2026 (%)
- 7.5 North America – Market size and forecast 2021-2026
- Exhibit 58: Chart on North America – Market size and forecast 2021-2026 ($ million)
- Exhibit 59: Data Table on North America – Market size and forecast 2021-2026 ($ million)
- Exhibit 60: Chart on North America – Year-over-year growth 2021-2026 (%)
- Exhibit 61: Data Table on North America – Year-over-year growth 2021-2026 (%)
- 7.6 South America – Market size and forecast 2021-2026
- Exhibit 62: Chart on South America – Market size and forecast 2021-2026 ($ million)
- Exhibit 63: Data Table on South America – Market size and forecast 2021-2026 ($ million)
- Exhibit 64: Chart on South America – Year-over-year growth 2021-2026 (%)
- Exhibit 65: Data Table on South America – Year-over-year growth 2021-2026 (%)
- 7.7 Middle East and Africa – Market size and forecast 2021-2026
- Exhibit 66: Chart on Middle East and Africa – Market size and forecast 2021-2026 ($ million)
- Exhibit 67: Data Table on Middle East and Africa – Market size and forecast 2021-2026 ($ million)
- Exhibit 68: Chart on Middle East and Africa – Year-over-year growth 2021-2026 (%)
- Exhibit 69: Data Table on Middle East and Africa – Year-over-year growth 2021-2026 (%)
- 7.8 China – Market size and forecast 2021-2026
- Exhibit 70: Chart on China – Market size and forecast 2021-2026 ($ million)
- Exhibit 71: Data Table on China – Market size and forecast 2021-2026 ($ million)
- Exhibit 72: Chart on China – Year-over-year growth 2021-2026 (%)
- Exhibit 73: Data Table on China – Year-over-year growth 2021-2026 (%)
- 7.9 US – Market size and forecast 2021-2026
- Exhibit 74: Chart on the US – Market size and forecast 2021-2026 ($ million)
- Exhibit 75: Data Table on the US – Market size and forecast 2021-2026 ($ million)
- Exhibit 76: Chart on US – Year-over-year growth 2021-2026 (%)
- Exhibit 77: Data Table on the US – Year-over-year growth 2021-2026 (%)
- 7.10 Japan – Market size and forecast 2021-2026
- Exhibit 78: Chart on Japan – Market size and forecast 2021-2026 ($ million)
- Exhibit 79: Data Table on Japan – Market size and forecast 2021-2026 ($ million)
- Exhibit 80: Chart on Japan – Year-over-year growth 2021-2026 (%)
- Exhibit 81: Data Table on Japan – Year-over-year growth 2021-2026 (%)
- 7.11 Germany – Market size and forecast 2021-2026
- Exhibit 82: Chart on Germany – Market size and forecast 2021-2026 ($ million)
- Exhibit 83: Data Table on Germany – Market size and forecast 2021-2026 ($ million)
- Exhibit 84: Chart on Germany – Year-over-year growth 2021-2026 (%)
- Exhibit 85: Data Table on Germany – Year-over-year growth 2021-2026 (%)
- 7.12 South Korea – Market size and forecast 2021-2026
- Exhibit 86: Chart on South Korea – Market size and forecast 2021-2026 ($ million)
- Exhibit 87: Data Table on South Korea – Market size and forecast 2021-2026 ($ million)
- Exhibit 88: Chart on South Korea – Year-over-year growth 2021-2026 (%)
- Exhibit 89: Data Table on South Korea – Year-over-year growth 2021-2026 (%)
- 7.13 Market opportunity by geography
- Exhibit 90: Market opportunity by geography ($ million)
8 Drivers, Challenges, and Trends
- 8.1 Market drivers
- 8.2 Market challenges
- 8.3 Impact of drivers and challenges
- Exhibit 91: Impact of drivers and challenges in 2021 and 2026
- 8.4 Market trends
9 Vendor Landscape
- 9.1 Overview
- 9.2 Vendor landscape
- Exhibit 92: Overview on Criticality of inputs and Factors of differentiation
- 9.3 Landscape disruption
- Exhibit 93: Overview on factors of disruption
- 9.4 Industry risks
- Exhibit 94: Impact of key risks on business
10 Vendor Analysis
- 10.1 Vendors covered
- Exhibit 95: Vendors covered
- 10.2 Market positioning of vendors
- Exhibit 96: Matrix on vendor position and classification
- 10.3 Burke Porter Group
- Exhibit 97: Burke Porter Group – Overview
- Exhibit 98: Burke Porter Group – Product / Service
- Exhibit 99: Burke Porter Group – Key offerings
- 10.4 Concept Systems Inc.
- Exhibit 100: Concept Systems Inc. – Overview
- Exhibit 101: Concept Systems Inc. – Product / Service
- Exhibit 102: Concept Systems Inc. – Key offerings
- 10.5 FH Automation
- Exhibit 103: FH Automation – Overview
- Exhibit 104: FH Automation – Product / Service
- Exhibit 105: FH Automation – Key offerings
- 10.6 Geku Automation
- Exhibit 106: Geku Automation – Overview
- Exhibit 107: Geku Automation – Product / Service
- Exhibit 108: Geku Automation – Key offerings
- 10.7 Hitachi Ltd.
- Exhibit 109: Hitachi Ltd. – Overview
- Exhibit 110: Hitachi Ltd. – Business segments
- Exhibit 111: Hitachi Ltd. – Key news
- Exhibit 112: Hitachi Ltd. – Key offerings
- Exhibit 113: Hitachi Ltd. – Segment focus
- 10.8 IPG Photonics Corp.
- Exhibit 114: IPG Photonics Corp. – Overview
- Exhibit 115: IPG Photonics Corp. – Product / Service
- Exhibit 116: IPG Photonics Corp. – Key offerings
- 10.9 Midwest Engineered Systems Inc.
- Exhibit 117: Midwest Engineered Systems Inc. – Overview
- Exhibit 118: Midwest Engineered Systems Inc. – Product / Service
- Exhibit 119: Midwest Engineered Systems Inc. – Key offerings
- 10.10 Phoenix Control Systems Ltd.
- Exhibit 120: Phoenix Control Systems Ltd. – Overview
- Exhibit 121: Phoenix Control Systems Ltd. – Product / Service
- Exhibit 122: Phoenix Control Systems Ltd. – Key offerings
- 10.11 RobotWorx
- Exhibit 123: RobotWorx – Overview
- Exhibit 124: RobotWorx – Product / Service
- Exhibit 125: RobotWorx – Key offerings
- 10.12 TASI Group
- Exhibit 126: TASI Group – Overview
- Exhibit 127: TASI Group – Product / Service
- Exhibit 128: TASI Group – Key offerings
11 Appendix
- 11.1 Scope of the report
- 11.2 Inclusions and exclusions checklist
- Exhibit 129: Inclusions checklist
- Exhibit 130: Exclusions checklist
- 11.3 Currency conversion rates for US$
- Exhibit 131: Currency conversion rates for US$
- 11.4 Research methodology
- Exhibit 132: Research methodology
- Exhibit 133: Validation techniques employed for market sizing
- Exhibit 134: Information sources
- 11.5 List of abbreviations
- Exhibit 135: List of abbreviations
Technavio is a leading global technology research and advisory company. Their research and analysis focus on emerging market trends and provide actionable insights to help businesses identify market opportunities and develop effective strategies to optimize their market positions. With over 500 specialized analysts, Technavio’s report library consists of more than 17,000 reports and counting, covering 800 technologies, spanning 50 countries. Their client base consists of enterprises of all sizes, including more than 100 Fortune 500 companies. This growing client base relies on Technavio’s comprehensive coverage, extensive research, and actionable market insights to identify opportunities in existing and potential markets and assess their competitive positions within changing market scenarios.
Technavio Research
Jesse Maida
Media & Marketing Executive
US: +1 844 364 1100
UK: +44 203 893 3200
Email: media@technavio.com
Website: www.technavio.com/
![]()
![]() View original content to download multimedia:https://www.prnewswire.com/news-releases/robotics-system-integration-market-46-of-growth-to-originate-from-apac-evolving-opportunities-with-borke-porter-group–hitachi-ltd–technavio-301598896.html
View original content to download multimedia:https://www.prnewswire.com/news-releases/robotics-system-integration-market-46-of-growth-to-originate-from-apac-evolving-opportunities-with-borke-porter-group–hitachi-ltd–technavio-301598896.html
SOURCE Technavio

Source link
The content is by PR Newswire. Headlines of Today Media is not responsible for the content provided or any links related to this content. Headlines of Today Media is not responsible for the correctness, topicality or the quality of the content.