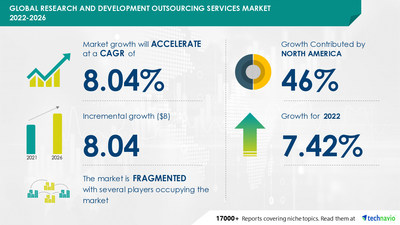
NEW YORK, June 29, 2022 /PRNewswire/ — The “Research and Development Outsourcing Services Market by End-user and Geography – Forecast and Analysis 2022-2026” report has been added to Technavio’s offering. According to the report, the market will observe an incremental growth of USD 8.04 billion between 2021 and 2026, expanding at a CAGR of 8.04% during the forecast period. The report highlights North America as the key market and the region is expected to generate significant growth opportunities for market players.

View Our Report Now for highlights on the market size, growth momentum, and other important statistics.
The global research and development outsourcing services market is fragmented, and the degree of fragmentation will accelerate during the forecast period. The market is characterized by the presence of several global and regional vendors. Global vendors have established a strong footprint in diversified geographies. They are leveraging advanced technologies to offer high-quality R and D outsourcing services to end-users. Technavio identifies Accenture Plc, Altair Engineering Inc., Capgemini Service SAS, Cisco Systems Inc., Cyient Ltd., DXC Technology Co., HCL Technologies Ltd., Hitachi Ltd., IAV GmbH, Infosys Ltd., Kistler Holding AG, KPIT Technologies Ltd., Mindfire Solutions, Mindtree Ltd., QuEST Global Services Pte. Ltd., Sonata Software Ltd., Tata Consultancy Services Ltd., Tech Mahindra Ltd., and Wipro Ltd. as some of the major market participants.
Although the cost-effectiveness of outsourcing research and development services, increasing need to focus on core competencies, and increased access to the global talent pool will offer immense growth opportunities, issues caused by inefficient communication, the threat of compromise on research and development quality, and the threat to data security and privacy will challenge the growth of the market participants. To make the most of the opportunities, market vendors should focus more on the growth prospects in the fast-growing segments, while maintaining their positions in the slow-growing segments.
Know more about the vendor landscape and the factors influencing their growth. Read Our Sample Report Now
The global research and development outsourcing services market is segmented as below:
- End-user
- Automotive
- Consumer Electronics
- Telecommunications
- Semiconductor
- Others
The automotive industry is the prime end-user of research and development outsourcing services. The segment is driven by the increasing adoption of autonomous and electric vehicles globally.
- Geography
- North America
- Europe
- APAC
- South America
- Middle East and Africa
North America will have the largest share of the market. About 46% of the market growth is expected to originate from the region. The increasing demand for R&D outsourcing services from industries such as aerospace, semiconductor, and consumer electronics is driving the growth of the regional market. Also, the construction of new data centers and the renovation of existing data centers is expected to have a positive impact on the growth of the research and development outsourcing services market in North America.
Technavio presents a detailed picture of the market by the way of study, synthesis, and summation of data from multiple sources. Our research and development outsourcing services market report covers the following areas:
- Research and Development Outsourcing Services Market size
- Research and Development Outsourcing Services Market trends
- Research and Development Outsourcing Services Market industry analysis
We provide a detailed analysis of around 25 vendors operating in the research and development outsourcing services market. Backed with competitive intelligence and benchmarking, our research report on the research and development outsourcing services market is designed to provide entry support, customer profile, and M&As as well as go-to-market strategy support.
- CAGR of the market during the forecast period 2022-2026
- Detailed information on factors that will assist research and development outsourcing services market growth during the next five years
- Estimation of the research and development outsourcing services market size and its contribution to the parent market
- Predictions on upcoming trends and changes in consumer behavior
- The growth of the research and development outsourcing services market
- Analysis of the market’s competitive landscape and detailed information on vendors
- Comprehensive details of factors that will challenge the growth of research and development outsourcing services market vendors
Related Reports:
- Document Outsourcing Market by Outsourcing Services and Geography – Forecast and Analysis 2021-2025
- Regulatory Affairs Outsourcing Market by End-user and Geography – Forecast and Analysis 2022-2026
|
Research and Development Outsourcing Services Market Scope |
|
|
Report Coverage |
Details |
|
Page number |
120 |
|
Base year |
2021 |
|
Forecast period |
2022-2026 |
|
Growth momentum & CAGR |
Accelerate at a CAGR of 8.04% |
|
Market growth 2022-2026 |
USD 8.04 billion |
|
Market structure |
Fragmented |
|
YoY growth (%) |
7.42 |
|
Regional analysis |
North America, Europe, APAC, South America, and Middle East and Africa |
|
Performing market contribution |
North America at 46% |
|
Key consumer countries |
US, China, India, Germany, and UK |
|
Competitive landscape |
Leading companies, competitive strategies, consumer engagement scope |
|
Companies profiled |
Accenture Plc, Altair Engineering Inc., Capgemini Service SAS, Cisco Systems Inc., Cyient Ltd., DXC Technology Co., HCL Technologies Ltd., Hitachi Ltd., IAV GmbH, Infosys Ltd., Kistler Holding AG, KPIT Technologies Ltd., Mindfire Solutions, Mindtree Ltd., QuEST Global Services Pte. Ltd., Sonata Software Ltd., Tata Consultancy Services Ltd., Tech Mahindra Ltd., and Wipro Ltd. |
|
Market Dynamics |
Parent market analysis, Market growth inducers and obstacles, Fast-growing and slow-growing segment analysis, COVID 19 impact and future consumer dynamics, market condition analysis for the forecast period. |
|
Customization purview |
If our report has not included the data that you are looking for, you can reach out to our analysts and get segments customized. |
Table Of Contents :
1 Executive Summary
- 1.1 Market overview
- Exhibit 01: Executive Summary – Chart on Market Overview
- Exhibit 02: Executive Summary – Data Table on Market Overview
- Exhibit 03: Executive Summary – Chart on Global Market Characteristics
- Exhibit 04: Executive Summary – Chart on Market by Geography
- Exhibit 05: Executive Summary – Chart on Market Segmentation by End-user
- Exhibit 06: Executive Summary – Chart on Incremental Growth
- Exhibit 07: Executive Summary – Data Table on Incremental Growth
- Exhibit 08: Executive Summary – Chart on Vendor Market Positioning
2 Market Landscape
- 2.1 Market ecosystem
- Exhibit 09: Parent market
- Exhibit 10: Market Characteristics
3 Market Sizing
- 3.1 Market definition
- Exhibit 11: Offerings of vendors included in the market definition
- 3.2 Market segment analysis
- Exhibit 12: Market segments
- 3.3 Market size 2021
- 3.4 Market outlook: Forecast for 2021-2026
- Exhibit 13: Chart on Global – Market size and forecast 2021-2026 ($ million)
- Exhibit 14: Data Table on Global – Market size and forecast 2021-2026 ($ million)
- Exhibit 15: Chart on Global Market: Year-over-year growth 2021-2026 (%)
- Exhibit 16: Data Table on Global Market: Year-over-year growth 2021-2026 (%)
4 Five Forces Analysis
- 4.1 Five forces summary
- Exhibit 17: Five forces analysis – Comparison between 2021 and 2026
- 4.2 Bargaining power of buyers
- Exhibit 18: Chart on Bargaining power of buyers – Impact of key factors 2021 and 2026
- 4.3 Bargaining power of suppliers
- Exhibit 19: Bargaining power of suppliers – Impact of key factors in 2021 and 2026
- 4.4 Threat of new entrants
- Exhibit 20: Threat of new entrants – Impact of key factors in 2021 and 2026
- 4.5 Threat of substitutes
- Exhibit 21: Threat of substitutes – Impact of key factors in 2021 and 2026
- 4.6 Threat of rivalry
- Exhibit 22: Threat of rivalry – Impact of key factors in 2021 and 2026
- 4.7 Market condition
- Exhibit 23: Chart on Market condition – Five forces 2021 and 2026
5 Market Segmentation by End-user
- 5.1 Market segments
- Exhibit 24: Chart on End-user – Market share 2021-2026 (%)
- Exhibit 25: Data Table on End-user – Market share 2021-2026 (%)
- 5.2 Comparison by End-user
- Exhibit 26: Chart on Comparison by End-user
- Exhibit 27: Data Table on Comparison by End-user
- 5.3 Automotive – Market size and forecast 2021-2026
- Exhibit 28: Chart on Automotive – Market size and forecast 2021-2026 ($ million)
- Exhibit 29: Data Table on Automotive – Market size and forecast 2021-2026 ($ million)
- Exhibit 30: Chart on Automotive – Year-over-year growth 2021-2026 (%)
- Exhibit 31: Data Table on Automotive – Year-over-year growth 2021-2026 (%)
- 5.4 Consumer electronics – Market size and forecast 2021-2026
- Exhibit 32: Chart on Consumer electronics – Market size and forecast 2021-2026 ($ million)
- Exhibit 33: Data Table on Consumer electronics – Market size and forecast 2021-2026 ($ million)
- Exhibit 34: Chart on Consumer electronics – Year-over-year growth 2021-2026 (%)
- Exhibit 35: Data Table on Consumer electronics – Year-over-year growth 2021-2026 (%)
- 5.5 Telecommunications – Market size and forecast 2021-2026
- Exhibit 36: Chart on Telecommunications – Market size and forecast 2021-2026 ($ million)
- Exhibit 37: Data Table on Telecommunications – Market size and forecast 2021-2026 ($ million)
- Exhibit 38: Chart on Telecommunications – Year-over-year growth 2021-2026 (%)
- Exhibit 39: Data Table on Telecommunications – Year-over-year growth 2021-2026 (%)
- 5.6 Semiconductor – Market size and forecast 2021-2026
- Exhibit 40: Chart on Semiconductor – Market size and forecast 2021-2026 ($ million)
- Exhibit 41: Data Table on Semiconductor – Market size and forecast 2021-2026 ($ million)
- Exhibit 42: Chart on Semiconductor – Year-over-year growth 2021-2026 (%)
- Exhibit 43: Data Table on Semiconductor – Year-over-year growth 2021-2026 (%)
- 5.7 Others – Market size and forecast 2021-2026
- Exhibit 44: Chart on Others – Market size and forecast 2021-2026 ($ million)
- Exhibit 45: Data Table on Others – Market size and forecast 2021-2026 ($ million)
- Exhibit 46: Chart on Others – Year-over-year growth 2021-2026 (%)
- Exhibit 47: Data Table on Others – Year-over-year growth 2021-2026 (%)
- 5.8 Market opportunity by End-user
- Exhibit 48: Market opportunity by End-user ($ million)
6 Customer Landscape
- 6.1 Customer landscape overview
- Exhibit 49: Analysis of price sensitivity, lifecycle, customer purchase basket, adoption rates, and purchase criteria
7 Geographic Landscape
- 7.1 Geographic segmentation
- Exhibit 50: Chart on Market share by geography 2021-2026 (%)
- Exhibit 51: Data Table on Market share by geography 2021-2026 (%)
- 7.2 Geographic comparison
- Exhibit 52: Chart on Geographic comparison
- Exhibit 53: Data Table on Geographic comparison
- 7.3 North America – Market size and forecast 2021-2026
- Exhibit 54: Chart on North America – Market size and forecast 2021-2026 ($ million)
- Exhibit 55: Data Table on North America – Market size and forecast 2021-2026 ($ million)
- Exhibit 56: Chart on North America – Year-over-year growth 2021-2026 (%)
- Exhibit 57: Data Table on North America – Year-over-year growth 2021-2026 (%)
- 7.4 Europe – Market size and forecast 2021-2026
- Exhibit 58: Chart on Europe – Market size and forecast 2021-2026 ($ million)
- Exhibit 59: Data Table on Europe – Market size and forecast 2021-2026 ($ million)
- Exhibit 60: Chart on Europe – Year-over-year growth 2021-2026 (%)
- Exhibit 61: Data Table on Europe – Year-over-year growth 2021-2026 (%)
- 7.5 APAC – Market size and forecast 2021-2026
- Exhibit 62: Chart on APAC – Market size and forecast 2021-2026 ($ million)
- Exhibit 63: Data Table on APAC – Market size and forecast 2021-2026 ($ million)
- Exhibit 64: Chart on APAC – Year-over-year growth 2021-2026 (%)
- Exhibit 65: Data Table on APAC – Year-over-year growth 2021-2026 (%)
- 7.6 South America – Market size and forecast 2021-2026
- Exhibit 66: Chart on South America – Market size and forecast 2021-2026 ($ million)
- Exhibit 67: Data Table on South America – Market size and forecast 2021-2026 ($ million)
- Exhibit 68: Chart on South America – Year-over-year growth 2021-2026 (%)
- Exhibit 69: Data Table on South America – Year-over-year growth 2021-2026 (%)
- 7.7 Middle East and Africa – Market size and forecast 2021-2026
- Exhibit 70: Chart on Middle East and Africa – Market size and forecast 2021-2026 ($ million)
- Exhibit 71: Data Table on Middle East and Africa – Market size and forecast 2021-2026 ($ million)
- Exhibit 72: Chart on Middle East and Africa – Year-over-year growth 2021-2026 (%)
- Exhibit 73: Data Table on Middle East and Africa – Year-over-year growth 2021-2026 (%)
- 7.8 US – Market size and forecast 2021-2026
- Exhibit 74: Chart on US – Market size and forecast 2021-2026 ($ million)
- Exhibit 75: Data Table on US – Market size and forecast 2021-2026 ($ million)
- Exhibit 76: Chart on US – Year-over-year growth 2021-2026 (%)
- Exhibit 77: Data Table on US – Year-over-year growth 2021-2026 (%)
- 7.9 China – Market size and forecast 2021-2026
- Exhibit 78: Chart on China – Market size and forecast 2021-2026 ($ million)
- Exhibit 79: Data Table on China – Market size and forecast 2021-2026 ($ million)
- Exhibit 80: Chart on China – Year-over-year growth 2021-2026 (%)
- Exhibit 81: Data Table on China – Year-over-year growth 2021-2026 (%)
- 7.10 Germany – Market size and forecast 2021-2026
- Exhibit 82: Chart on Germany – Market size and forecast 2021-2026 ($ million)
- Exhibit 83: Data Table on Germany – Market size and forecast 2021-2026 ($ million)
- Exhibit 84: Chart on Germany – Year-over-year growth 2021-2026 (%)
- Exhibit 85: Data Table on Germany – Year-over-year growth 2021-2026 (%)
- 7.11 India – Market size and forecast 2021-2026
- Exhibit 86: Chart on India – Market size and forecast 2021-2026 ($ million)
- Exhibit 87: Data Table on India – Market size and forecast 2021-2026 ($ million)
- Exhibit 88: Chart on India – Year-over-year growth 2021-2026 (%)
- Exhibit 89: Data Table on India – Year-over-year growth 2021-2026 (%)
- 7.12 UK – Market size and forecast 2021-2026
- Exhibit 90: Chart on UK – Market size and forecast 2021-2026 ($ million)
- Exhibit 91: Data Table on UK – Market size and forecast 2021-2026 ($ million)
- Exhibit 92: Chart on UK – Year-over-year growth 2021-2026 (%)
- Exhibit 93: Data Table on UK – Year-over-year growth 2021-2026 (%)
- 7.13 Market opportunity by geography
- Exhibit 94: Market opportunity by geography ($ million)
8 Drivers, Challenges, and Trends
- 8.1 Market drivers
- 8.2 Market challenges
- 8.3 Impact of drivers and challenges
- Exhibit 95: Impact of drivers and challenges in 2021 and 2026
- 8.4 Market trends
9 Vendor Landscape
- 9.1 Overview
- 9.2 Vendor landscape
- Exhibit 96: Overview on Criticality of inputs and Factors of differentiation
- 9.3 Landscape disruption
- Exhibit 97: Overview on factors of disruption
- 9.4 Industry risks
- Exhibit 98: Impact of key risks on business
10 Vendor Analysis
- 10.1 Vendors covered
- Exhibit 99: Vendors covered
- 10.2 Market positioning of vendors
- Exhibit 100: Matrix on vendor position and classification
- 10.3 Altair Engineering Inc.
- Exhibit 101: Altair Engineering Inc. – Overview
- Exhibit 102: Altair Engineering Inc. – Business segments
- Exhibit 103: Altair Engineering Inc. – Key offerings
- Exhibit 104: Altair Engineering Inc. – Segment focus
- 10.4 Capgemini Service SAS
- Exhibit 105: Capgemini Service SAS – Overview
- Exhibit 106: Capgemini Service SAS – Business segments
- Exhibit 107: Capgemini Service SAS – Key news
- Exhibit 108: Capgemini Service SAS – Key offerings
- Exhibit 109: Capgemini Service SAS – Segment focus
- 10.5 IAV GmbH
- Exhibit 110: IAV GmbH – Overview
- Exhibit 111: IAV GmbH – Product / Service
- Exhibit 112: IAV GmbH – Key offerings
- 10.6 Infosys Ltd.
- Exhibit 113: Infosys Ltd. – Overview
- Exhibit 114: Infosys Ltd. – Business segments
- Exhibit 115: Infosys Ltd. – Key news
- Exhibit 116: Infosys Ltd. – Key offerings
- Exhibit 117: Infosys Ltd. – Segment focus
- 10.7 Kistler Holding AG
- Exhibit 118: Kistler Holding AG – Overview
- Exhibit 119: Kistler Holding AG – Product / Service
- Exhibit 120: Kistler Holding AG – Key offerings
- 10.8 KPIT Technologies Ltd.
- Exhibit 121: KPIT Technologies Ltd. – Overview
- Exhibit 122: KPIT Technologies Ltd. – Product / Service
- Exhibit 123: KPIT Technologies Ltd. – Key offerings
- 10.9 Mindtree Ltd.
- Exhibit 124: Mindtree Ltd. – Overview
- Exhibit 125: Mindtree Ltd. – Business segments
- Exhibit 126: Mindtree Ltd. – Key offerings
- Exhibit 127: Mindtree Ltd. – Segment focus
- 10.10 Tata Consultancy Services Ltd.
- Exhibit 128: Tata Consultancy Services Ltd. – Overview
- Exhibit 129: Tata Consultancy Services Ltd. – Business segments
- Exhibit 130: Tata Consultancy Services Ltd. – Key news
- Exhibit 131: Tata Consultancy Services Ltd. – Key offerings
- Exhibit 132: Tata Consultancy Services Ltd. – Segment focus
- 10.11 Tech Mahindra Ltd.
- Exhibit 133: Tech Mahindra Ltd. – Overview
- Exhibit 134: Tech Mahindra Ltd. – Business segments
- Exhibit 135: Tech Mahindra Ltd. – Key offerings
- Exhibit 136: Tech Mahindra Ltd. – Segment focus
- 10.12 Wipro Ltd.
- Exhibit 137: Wipro Ltd. – Overview
- Exhibit 138: Wipro Ltd. – Business segments
- Exhibit 139: Wipro Ltd. – Key news
- Exhibit 140: Wipro Ltd. – Key offerings
- Exhibit 141: Wipro Ltd. – Segment focus
11 Appendix
- 11.1 Scope of the report
- 11.2 Inclusions and exclusions checklist
- Exhibit 142: Inclusions checklist
- 11.3 Currency conversion rates for US$
- Exhibit 143: Currency conversion rates for US$
- 11.4 Research methodology
- Exhibit 144: Research methodology
- Exhibit 145: Validation techniques employed for market sizing
- Exhibit 146: Information sources
- 11.5 List of abbreviations
- Exhibit 147: List of abbreviations
Technavio is a leading global technology research and advisory company. Their research and analysis focus on emerging market trends and provides actionable insights to help businesses identify market opportunities and develop effective strategies to optimize their market positions. With over 500 specialized analysts, Technavio’s report library consists of more than 17,000 reports and counting, covering 800 technologies, spanning across 50 countries. Their client base consists of enterprises of all sizes, including more than 100 Fortune 500 companies. This growing client base relies on Technavio’s comprehensive coverage, extensive research, and actionable market insights to identify opportunities in existing and potential markets and assess their competitive positions within changing market scenarios.
Technavio Research
Jesse Maida
Media & Marketing Executive
US: +1 844 364 1100
UK: +44 203 893 3200
Email: media@technavio.com
Website: www.technavio.com/
![]()
![]() View original content to download multimedia:https://www.prnewswire.com/news-releases/research-and-development-outsourcing-services-market-to-witness-usd-8-04-bn-growth–driven-by-the-cost-effectiveness-of-outsourcing-research-and-development-services–technavio-301576987.html
View original content to download multimedia:https://www.prnewswire.com/news-releases/research-and-development-outsourcing-services-market-to-witness-usd-8-04-bn-growth–driven-by-the-cost-effectiveness-of-outsourcing-research-and-development-services–technavio-301576987.html
SOURCE Technavio

Source link
The content is by PR Newswire. Headlines of Today Media is not responsible for the content provided or any links related to this content. Headlines of Today Media is not responsible for the correctness, topicality or the quality of the content.