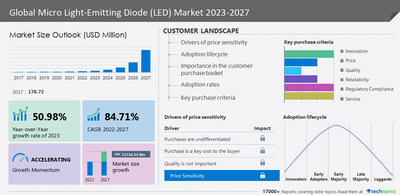
NEW YORK, May 29, 2023 /PRNewswire/ — The micro light-emitting diode (LED) market size is estimated to increase by USD 11,716.23 million from 2022 to 2027, with an over CAGR of 84.71%, according to the recent market study by Technavio. This report also offers a 5-year historical (2017-2021) data projection of market size, segmentation, and region. Discover some insights on market size before buying the full report –Request a sample report
 Market 2023-2027")
Qualitative and quantitative analysis of vendors has been conducted to help clients understand the wider business environment as well as the strengths and weaknesses of key market players. Data is qualitatively analyzed to categorize vendors as pure play, category-focused, industry-focused, and diversified; it is quantitatively analyzed to categorize vendors as dominant, leading, strong, tentative, and weak. The Bargaining Power of Buyers & Suppliers and the Threat of New Entrants, Rivalry, and Substitutes have also been analyzed and rated between LOW-HIGH to provide a holistic view of market favorability.
Find Technavio’s Exclusive Analysis of Price Sensitivity, Adoption Lifecycle, Customer Purchase Basket, Adoption Rates, and Purchase Criteria
- One of the core components of the customer landscape is price sensitivity, an analysis of which will help companies refine marketing strategies to gain a competitive advantage.
- Another key aspect is price sensitivity drivers (purchases are undifferentiated, the purchase is a key cost to buyers, and quality is not important), which range between LOW and HIGH.
- Furthermore, market adoption rates for all regions have been covered.
The micro light-emitting diode (LED) market report also offers information on the criticality of inputs, R&D, CAPEX, technology, and products of 15 vendors listed Below –
Aledia SA, ALLOS Semiconductors GmbH, Apple Inc., AUO Corp., Beijing BDK Electronics Co. Ltd., eLux Inc., EPISTAR Corp, Innolux Corp., JBD Inc., LG Electronics Inc., Lumens Co. Ltd, Nanosys Inc., Optovate Ltd., OSRAM GmbH, PlayNitride Inc., Plessey Semiconductors Ltd., Rohinni LLC, Samsung Electronics Co. Ltd., Sony Group Corp., and VueReal Inc.
Micro Light-Emitting Diode (LED) Market – Segmentation
The market is segmented by product (display and lighting), type (microdisplay, small and medium panel, and large panel), and geography (APAC, North America, Europe, South America, and Middle East and Africa).
- The market share growth by the display segment is significant during the forecast period. MicroLED displays can be used in a variety of applications including consumer electronics such as TVs and smartphones, mobile wearables, large screens, digital signage, and augmented/virtual reality (AR/VR) headsets. But many of the MicroLED markets for these applications are still in the development stage and have not yet been commercialized. Additionally, OLED is gaining momentum among TV OEMs as it does not require backlighting and offers better viewing angles. Hence, such factors drive segment growth during the forecast period.
To procure the data – Buy report!
Micro Light-Emitting Diode (LED) Market – Market Dynamics
Drivers
- Increasing investments in MicroLEDs notably drive the micro-LED market growth.
- MicroLED is a new technology gaining popularity in the market. This is due to its high efficiency, low power consumption, and excellent brightness. MicroLEDs are used in lighting, navigation, and entertainment systems, in the automotive industry.
- In the consumer electronics industry, they are used in displays, smartphones, and wearable devices, whereas in healthcare, MicroLEDs are used in medical devices and diagnostics.
- Hence, the increasing investment in MicroLED by various players coupled with increasing demand for MicroLED in various industries will drive the growth of the market during the forecast period.
Trends
- The development of GaN-on-Si technology is an emerging trend influencing the micro light-emitting diode market growth.
- LED production is based on sapphire substrates but as MicroLEDs gain market acceptance, the vendors move to gallium nitride-on-silicon (GaN-on-Si) technology for MicroLED production.
- The advantage of using GaN-on-Si instead of the sapphire substrate is higher yield. Several providers are working to develop this technology.
- For instance, recently, Plessey Semiconductors partnered with Jasper Display Corp. (Jasper Display) and announced the development of a monolithic MicroLED display.
- Hence, the development of such products is expected to roll out in the consumer electronics market during the forecast period.
Challenges
- High market penetration of other display technologies challenges the micro-LED market growth.
- The main challenge is that display technologies such as plasma, TFT-LCD, LED-backlit LCD, and OLED displays are hitting the market at lower prices than MicroLED.
- Liquid crystal displays (LCDs) dominate the display market and are used in a wide variety of electronic devices such as mobile phones, handheld video game devices, televisions, laptops, and desktops.
- Additionally, OLEDs are also gaining popularity among display makers because they are thinner, lighter, and more flexible than LCDs and LEDs.
- Hence, such factors impede market growth during the forecast period.
Geographical Analysis
The market is segmented by region APAC, North America, Europe, South America, and Middle East and Africa. An analysis of key leading countries has been included.
- APAC is estimated to account for 69% of the global market growth during the forecast period. Market buyers include electronics OEMs, automotive OEMs, and lighting manufacturers. Presently, most MicroLED developments focus on AR/VR devices, TVs, digital signage, and big screens. This region is one of the likely markets for MicroLED, as the majority of market players involved in MicroLED development are located in APAC. APAC has a high concentration of consumer electronics manufacturers. The majority of consumer electronics manufacturing bases are located in South Korea, Taiwan, Japan, and China. Hence, such factors drive regional growth during the forecast period.
For Insights on the market dynamics & segmentations VIEW PDF SAMPLE !
What are the key data covered in this Micro Light-Emitting Diode (LED) Market report?
- CAGR of the market during the forecast period
- Detailed information on factors that will drive the growth of the Micro Light-Emitting Diode (LED) Market between 2023 and 2027
- Precise estimation of the Micro Light-Emitting Diode (LED) Market size and its contribution to the market with a focus on the parent market
- Accurate predictions about upcoming trends and changes in consumer behavior
- Growth of the Micro Light-Emitting Diode (LED) Market across APAC, North America, Europe, South America, and Middle East and Africa
- A thorough analysis of the market’s competitive landscape and detailed information about vendors
- Comprehensive analysis of factors that will challenge the growth of Micro Light-Emitting Diode (LED) Market vendors
Gain instant access to 17,000+ market research reports.
Technavio’s SUBSCRIPTION platform
Related Reports:
The led lighting market is estimated to grow at a CAGR of 7.35% between 2022 and 2027. The size of the market is forecast to increase by USD 34.82 billion. This led market research report extensively covers market segmentation by application (residential, commercial, outdoor, industrial, and others), product (luminaries and lamps), and geography (APAC, Europe, North America, Middle East and Africa, and South America). The declining manufacturing cost of LED lights is notably driving the market growth.
The organic light-emitting diode (OLED) market is estimated to grow at a CAGR of 13.84% between 2022 and 2027. The size of the market is forecast to increase by USD 39,447.32 million. This report extensively covers market segmentation by product (OLED display and OLED lighting), type (rigid and flexible), and geography (APAC, North America, Europe, South America, and Middle East and Africa). The increasing number of patent-related activities by market vendors is notably driving the market growth.
|
Micro Light-Emitting Diode (LED) Market Scope |
|
|
Report Coverage |
Details |
|
Base year |
2022 |
|
Historic period |
2017-2021 |
|
Forecast period |
2023-2027 |
|
Growth momentum & CAGR |
Accelerate at a CAGR of 84.71% |
|
Market growth 2023-2027 |
USD 11,716.23 million |
|
Market structure |
Fragmented |
|
YoY growth 2022-2023 (%) |
50.98 |
|
Regional analysis |
APAC, North America, Europe, South America, and Middle East and Africa |
|
Performing market contribution |
APAC at 69% |
|
Key countries |
US, South Korea, China, Japan, and Taiwan |
|
Competitive landscape |
Leading Vendors, Market Positioning of Vendors, Competitive Strategies, and Industry Risks |
|
Key companies profiled |
Aledia SA, ALLOS Semiconductors GmbH, Apple Inc., AUO Corp., Beijing BDK Electronics Co. Ltd., eLux Inc., EPISTAR Corp, Innolux Corp., JBD Inc., LG Electronics Inc., Lumens Co. Ltd, Nanosys Inc., Optovate Ltd., OSRAM GmbH, PlayNitride Inc., Plessey Semiconductors Ltd., Rohinni LLC, Samsung Electronics Co. Ltd., Sony Group Corp., and VueReal Inc. |
|
Market dynamics |
Parent market analysis, Market growth inducers and obstacles, Fast-growing and slow-growing segment analysis, COVID-19 impact and recovery analysis and future consumer dynamics, Market condition analysis for forecast period. |
|
Customization purview |
If our report has not included the data that you are looking for, you can reach out to our analysts and get segments customized. |
Table of Contents
1 Executive Summary
- 1.1 Market overview
- Exhibit 01: Executive Summary – Chart on Market Overview
- Exhibit 02: Executive Summary – Data Table on Market Overview
- Exhibit 03: Executive Summary – Chart on Global Market Characteristics
- Exhibit 04: Executive Summary – Chart on Market by Geography
- Exhibit 05: Executive Summary – Chart on Market Segmentation by Product
- Exhibit 06: Executive Summary – Chart on Market Segmentation by Type
- Exhibit 07: Executive Summary – Chart on Incremental Growth
- Exhibit 08: Executive Summary – Data Table on Incremental Growth
- Exhibit 09: Executive Summary – Chart on Vendor Market Positioning
2 Market Landscape
- 2.1 Market ecosystem
- Exhibit 10: Parent market
- Exhibit 11: Market Characteristics
3 Market Sizing
- 3.1 Market definition
- Exhibit 12: Offerings of vendors included in the market definition
- 3.2 Market segment analysis
- Exhibit 13: Market segments
- 3.3 Market size 2022
- 3.4 Market outlook: Forecast for 2022-2027
- Exhibit 14: Chart on Global – Market size and forecast 2022-2027 ($ million)
- Exhibit 15: Data Table on Global – Market size and forecast 2022-2027 ($ million)
- Exhibit 16: Chart on Global Market: Year-over-year growth 2022-2027 (%)
- Exhibit 17: Data Table on Global Market: Year-over-year growth 2022-2027 (%)
4 Historic Market Size
- 4.1 Global Micro Light-Emitting Diode (LED) Market 2017 – 2021
- Exhibit 18: Historic Market Size – Data Table on global micro light-emitting diode (led) Market 2017 – 2021 ($ million)
- 4.2 Product Segment Analysis 2017 – 2021
- Exhibit 19: Historic Market Size – Product Segment 2017 – 2021 ($ million)
- 4.3 Type Segment Analysis 2017 – 2021
- Exhibit 20: Historic Market Size – Type Segment 2017 – 2021 ($ million)
- 4.4 Geography Segment Analysis 2017 – 2021
- Exhibit 21: Historic Market Size – Geography Segment 2017 – 2021 ($ million)
- 4.5 Country Segment Analysis 2017 – 2021
- Exhibit 22: Historic Market Size – Country Segment 2017 – 2021 ($ million)
5 Five Forces Analysis
- 5.1 Five forces summary
- Exhibit 23: Five forces analysis – Comparison between 2022 and 2027
- 5.2 Bargaining power of buyers
- Exhibit 24: Chart on Bargaining power of buyers – Impact of key factors 2022 and 2027
- 5.3 Bargaining power of suppliers
- Exhibit 25: Bargaining power of suppliers – Impact of key factors in 2022 and 2027
- 5.4 Threat of new entrants
- Exhibit 26: Threat of new entrants – Impact of key factors in 2022 and 2027
- 5.5 Threat of substitutes
- Exhibit 27: Threat of substitutes – Impact of key factors in 2022 and 2027
- 5.6 Threat of rivalry
- Exhibit 28: Threat of rivalry – Impact of key factors in 2022 and 2027
- 5.7 Market condition
- Exhibit 29: Chart on Market condition – Five forces 2022 and 2027
6 Market Segmentation by Product
- 6.1 Market segments
- Exhibit 30: Chart on Product – Market share 2022-2027 (%)
- Exhibit 31: Data Table on Product – Market share 2022-2027 (%)
- 6.2 Comparison by Product
- Exhibit 32: Chart on Comparison by Product
- Exhibit 33: Data Table on Comparison by Product
- 6.3 Display – Market size and forecast 2022-2027
- Exhibit 34: Chart on Display – Market size and forecast 2022-2027 ($ million)
- Exhibit 35: Data Table on Display – Market size and forecast 2022-2027 ($ million)
- Exhibit 36: Chart on Display – Year-over-year growth 2022-2027 (%)
- Exhibit 37: Data Table on Display – Year-over-year growth 2022-2027 (%)
- 6.4 Lighting – Market size and forecast 2022-2027
- Exhibit 38: Chart on Lighting – Market size and forecast 2022-2027 ($ million)
- Exhibit 39: Data Table on Lighting – Market size and forecast 2022-2027 ($ million)
- Exhibit 40: Chart on Lighting – Year-over-year growth 2022-2027 (%)
- Exhibit 41: Data Table on Lighting – Year-over-year growth 2022-2027 (%)
- 6.5 Market opportunity by Product
- Exhibit 42: Market opportunity by Product ($ million)
- Exhibit 43: Data Table on Market opportunity by Product ($ million)
7 Market Segmentation by Type
- 7.1 Market segments
- Exhibit 44: Chart on Type – Market share 2022-2027 (%)
- Exhibit 45: Data Table on Type – Market share 2022-2027 (%)
- 7.2 Comparison by Type
- Exhibit 46: Chart on Comparison by Type
- Exhibit 47: Data Table on Comparison by Type
- 7.3 Micro display – Market size and forecast 2022-2027
- Exhibit 48: Chart on Micro display – Market size and forecast 2022-2027 ($ million)
- Exhibit 49: Data Table on Micro display – Market size and forecast 2022-2027 ($ million)
- Exhibit 50: Chart on Micro display – Year-over-year growth 2022-2027 (%)
- Exhibit 51: Data Table on Micro display – Year-over-year growth 2022-2027 (%)
- 7.4 Small and medium panel – Market size and forecast 2022-2027
- Exhibit 52: Chart on Small and medium panel – Market size and forecast 2022-2027 ($ million)
- Exhibit 53: Data Table on Small and medium panel – Market size and forecast 2022-2027 ($ million)
- Exhibit 54: Chart on Small and medium panel – Year-over-year growth 2022-2027 (%)
- Exhibit 55: Data Table on Small and medium panel – Year-over-year growth 2022-2027 (%)
- 7.5 Large panel – Market size and forecast 2022-2027
- Exhibit 56: Chart on Large panel – Market size and forecast 2022-2027 ($ million)
- Exhibit 57: Data Table on Large panel – Market size and forecast 2022-2027 ($ million)
- Exhibit 58: Chart on Large panel – Year-over-year growth 2022-2027 (%)
- Exhibit 59: Data Table on Large panel – Year-over-year growth 2022-2027 (%)
- 7.6 Market opportunity by Type
- Exhibit 60: Market opportunity by Type ($ million)
- Exhibit 61: Data Table on Market opportunity by Type ($ million)
8 Customer Landscape
- 8.1 Customer landscape overview
- Exhibit 62: Analysis of price sensitivity, lifecycle, customer purchase basket, adoption rates, and purchase criteria
9 Geographic Landscape
- 9.1 Geographic segmentation
- Exhibit 63: Chart on Market share by geography 2022-2027 (%)
- Exhibit 64: Data Table on Market share by geography 2022-2027 (%)
- 9.2 Geographic comparison
- Exhibit 65: Chart on Geographic comparison
- Exhibit 66: Data Table on Geographic comparison
- 9.3 APAC – Market size and forecast 2022-2027
- Exhibit 67: Chart on APAC – Market size and forecast 2022-2027 ($ million)
- Exhibit 68: Data Table on APAC – Market size and forecast 2022-2027 ($ million)
- Exhibit 69: Chart on APAC – Year-over-year growth 2022-2027 (%)
- Exhibit 70: Data Table on APAC – Year-over-year growth 2022-2027 (%)
- 9.4 North America – Market size and forecast 2022-2027
- Exhibit 71: Chart on North America – Market size and forecast 2022-2027 ($ million)
- Exhibit 72: Data Table on North America – Market size and forecast 2022-2027 ($ million)
- Exhibit 73: Chart on North America – Year-over-year growth 2022-2027 (%)
- Exhibit 74: Data Table on North America – Year-over-year growth 2022-2027 (%)
- 9.5 Europe – Market size and forecast 2022-2027
- Exhibit 75: Chart on Europe – Market size and forecast 2022-2027 ($ million)
- Exhibit 76: Data Table on Europe – Market size and forecast 2022-2027 ($ million)
- Exhibit 77: Chart on Europe – Year-over-year growth 2022-2027 (%)
- Exhibit 78: Data Table on Europe – Year-over-year growth 2022-2027 (%)
- 9.6 South America – Market size and forecast 2022-2027
- Exhibit 79: Chart on South America – Market size and forecast 2022-2027 ($ million)
- Exhibit 80: Data Table on South America – Market size and forecast 2022-2027 ($ million)
- Exhibit 81: Chart on South America – Year-over-year growth 2022-2027 (%)
- Exhibit 82: Data Table on South America – Year-over-year growth 2022-2027 (%)
- 9.7 Middle East and Africa – Market size and forecast 2022-2027
- Exhibit 83: Chart on Middle East and Africa – Market size and forecast 2022-2027 ($ million)
- Exhibit 84: Data Table on Middle East and Africa – Market size and forecast 2022-2027 ($ million)
- Exhibit 85: Chart on Middle East and Africa – Year-over-year growth 2022-2027 (%)
- Exhibit 86: Data Table on Middle East and Africa – Year-over-year growth 2022-2027 (%)
- 9.8 South Korea – Market size and forecast 2022-2027
- Exhibit 87: Chart on South Korea – Market size and forecast 2022-2027 ($ million)
- Exhibit 88: Data Table on South Korea – Market size and forecast 2022-2027 ($ million)
- Exhibit 89: Chart on South Korea – Year-over-year growth 2022-2027 (%)
- Exhibit 90: Data Table on South Korea – Year-over-year growth 2022-2027 (%)
- 9.9 China – Market size and forecast 2022-2027
- Exhibit 91: Chart on China – Market size and forecast 2022-2027 ($ million)
- Exhibit 92: Data Table on China – Market size and forecast 2022-2027 ($ million)
- Exhibit 93: Chart on China – Year-over-year growth 2022-2027 (%)
- Exhibit 94: Data Table on China – Year-over-year growth 2022-2027 (%)
- 9.10 Japan – Market size and forecast 2022-2027
- Exhibit 95: Chart on Japan – Market size and forecast 2022-2027 ($ million)
- Exhibit 96: Data Table on Japan – Market size and forecast 2022-2027 ($ million)
- Exhibit 97: Chart on Japan – Year-over-year growth 2022-2027 (%)
- Exhibit 98: Data Table on Japan – Year-over-year growth 2022-2027 (%)
- 9.11 Taiwan – Market size and forecast 2022-2027
- Exhibit 99: Chart on Taiwan – Market size and forecast 2022-2027 ($ million)
- Exhibit 100: Data Table on Taiwan – Market size and forecast 2022-2027 ($ million)
- Exhibit 101: Chart on Taiwan – Year-over-year growth 2022-2027 (%)
- Exhibit 102: Data Table on Taiwan – Year-over-year growth 2022-2027 (%)
- 9.12 US – Market size and forecast 2022-2027
- Exhibit 103: Chart on US – Market size and forecast 2022-2027 ($ million)
- Exhibit 104: Data Table on US – Market size and forecast 2022-2027 ($ million)
- Exhibit 105: Chart on US – Year-over-year growth 2022-2027 (%)
- Exhibit 106: Data Table on US – Year-over-year growth 2022-2027 (%)
- 9.13 Market opportunity by geography
- Exhibit 107: Market opportunity by geography ($ million)
- Exhibit 108: Data Tables on Market opportunity by geography ($ million)
10 Drivers, Challenges, and Trends
- 10.1 Market drivers
- 10.2 Market challenges
- 10.3 Impact of drivers and challenges
- Exhibit 109: Impact of drivers and challenges in 2022 and 2027
- 10.4 Market trends
11 Vendor Landscape
- 11.1 Overview
- 11.2 Vendor landscape
- Exhibit 110: Overview on Criticality of inputs and Factors of differentiation
- 11.3 Landscape disruption
- Exhibit 111: Overview on factors of disruption
- 11.4 Industry risks
- Exhibit 112: Impact of key risks on business
12 Vendor Analysis
- 12.1 Vendors covered
- Exhibit 113: Vendors covered
- 12.2 Market positioning of vendors
- Exhibit 114: Matrix on vendor position and classification
- 12.3 Aledia SA
- Exhibit 115: Aledia SA – Overview
- Exhibit 116: Aledia SA – Product / Service
- Exhibit 117: Aledia SA – Key offerings
- 12.4 Apple Inc.
- Exhibit 118: Apple Inc. – Overview
- Exhibit 119: Apple Inc. – Business segments
- Exhibit 120: Apple Inc. – Key news
- Exhibit 121: Apple Inc. – Key offerings
- Exhibit 122: Apple Inc. – Segment focus
- 12.5 AUO Corp.
- Exhibit 123: AUO Corp. – Overview
- Exhibit 124: AUO Corp. – Business segments
- Exhibit 125: AUO Corp. – Key news
- Exhibit 126: AUO Corp. – Key offerings
- Exhibit 127: AUO Corp. – Segment focus
- 12.6 Beijing BDK Electronics Co. Ltd.
- Exhibit 128: Beijing BDK Electronics Co. Ltd. – Overview
- Exhibit 129: Beijing BDK Electronics Co. Ltd. – Product / Service
- Exhibit 130: Beijing BDK Electronics Co. Ltd. – Key offerings
- 12.7 EPISTAR Corp
- Exhibit 131: EPISTAR Corp – Overview
- Exhibit 132: EPISTAR Corp – Product / Service
- Exhibit 133: EPISTAR Corp – Key offerings
- 12.8 Innolux Corp.
- Exhibit 134: Innolux Corp. – Overview
- Exhibit 135: Innolux Corp. – Product / Service
- Exhibit 136: Innolux Corp. – Key offerings
- 12.9 JBD Inc.
- Exhibit 137: JBD Inc. – Overview
- Exhibit 138: JBD Inc. – Product / Service
- Exhibit 139: JBD Inc. – Key offerings
- 12.10 LG Electronics Inc.
- Exhibit 140: LG Electronics Inc. – Overview
- Exhibit 141: LG Electronics Inc. – Product / Service
- Exhibit 142: LG Electronics Inc. – Key offerings
- 12.11 Optovate Ltd.
- Exhibit 143: Optovate Ltd. – Overview
- Exhibit 144: Optovate Ltd. – Product / Service
- Exhibit 145: Optovate Ltd. – Key offerings
- 12.12 OSRAM GmbH
- Exhibit 146: OSRAM GmbH – Overview
- Exhibit 147: OSRAM GmbH – Business segments
- Exhibit 148: OSRAM GmbH – Key offerings
- Exhibit 149: OSRAM GmbH – Segment focus
- 12.13 PlayNitride Inc.
- Exhibit 150: PlayNitride Inc. – Overview
- Exhibit 151: PlayNitride Inc. – Product / Service
- Exhibit 152: PlayNitride Inc. – Key offerings
- 12.14 Plessey Semiconductors Ltd.
- Exhibit 153: Plessey Semiconductors Ltd. – Overview
- Exhibit 154: Plessey Semiconductors Ltd. – Product / Service
- Exhibit 155: Plessey Semiconductors Ltd. – Key offerings
- 12.15 Rohinni LLC
- Exhibit 156: Rohinni LLC – Overview
- Exhibit 157: Rohinni LLC – Product / Service
- Exhibit 158: Rohinni LLC – Key offerings
- 12.16 Samsung Electronics Co. Ltd.
- Exhibit 159: Samsung Electronics Co. Ltd. – Overview
- Exhibit 160: Samsung Electronics Co. Ltd. – Business segments
- Exhibit 161: Samsung Electronics Co. Ltd. – Key news
- Exhibit 162: Samsung Electronics Co. Ltd. – Key offerings
- Exhibit 163: Samsung Electronics Co. Ltd. – Segment focus
- 12.17 Sony Group Corp.
- Exhibit 164: Sony Group Corp. – Overview
- Exhibit 165: Sony Group Corp. – Business segments
- Exhibit 166: Sony Group Corp. – Key news
- Exhibit 167: Sony Group Corp. – Key offerings
- Exhibit 168: Sony Group Corp. – Segment focus
13 Appendix
- 13.1 Scope of the report
- 13.2 Inclusions and exclusions checklist
- Exhibit 169: Inclusions checklist
- Exhibit 170: Exclusions checklist
- 13.3 Currency conversion rates for US$
- Exhibit 171: Currency conversion rates for US$
- 13.4 Research methodology
- Exhibit 172: Research methodology
- Exhibit 173: Validation techniques employed for market sizing
- Exhibit 174: Information sources
- 13.5 List of abbreviations
- Exhibit 175: List of abbreviations
About Us
Technavio is a leading global technology research and advisory company. Their research and analysis focuses on emerging market trends and provides actionable insights to help businesses identify market opportunities and develop effective strategies to optimize their market positions. With over 500 specialized analysts, Technavio’s report library consists of more than 17,000 reports and counting, covering 800 technologies, spanning across 50 countries. Their client base consists of enterprises of all sizes, including more than 100 Fortune 500 companies. This growing client base relies on Technavio’s comprehensive coverage, extensive research, and actionable market insights to identify opportunities in existing and potential markets and assess their competitive positions within changing market scenarios.
Contact
Technavio Research
Jesse Maida
Media & Marketing Executive
US: +1 844 364 1100
UK: +44 203 893 3200
Email: media@technavio.com
Website: www.technavio.com/
![]()
![]() View original content to download multimedia:https://www.prnewswire.com/news-releases/micro-light-emitting-diode-led-market-size-to-grow-by-usd-11-716-23-million-from-2022-to-2027–increasing-investments-in-microleds-to-drive-market-growth—technavio-301835807.html
View original content to download multimedia:https://www.prnewswire.com/news-releases/micro-light-emitting-diode-led-market-size-to-grow-by-usd-11-716-23-million-from-2022-to-2027–increasing-investments-in-microleds-to-drive-market-growth—technavio-301835807.html
SOURCE Technavio

Source link
The content is by PR Newswire. Headlines of Today Media is not responsible for the content provided or any links related to this content. Headlines of Today Media is not responsible for the correctness, topicality or the quality of the content.