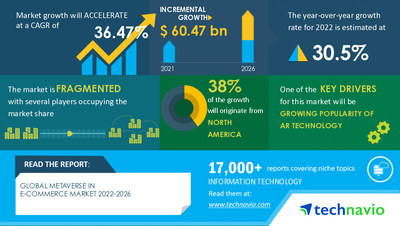
NEW YORK, Aug. 2, 2022 /PRNewswire/ — The Metaverse In E-commerce Market by Geography (North America, APAC, Europe, South America, and the Middle East and Africa) and Platform ( Computer, Mobile, and Headset) Forecast and Analysis 2022-2026 report has been added to Technavio’s offering. With ISO 9001:2015 certification, Technavio is proudly partnering with more than 100 Fortune 500 companies for over 16 years. The predicted growth of the metaverse in e-commerce market share from 2021 to 2026 is USD 60.47 billion at a progressing CAGR of 36.47%. Technavio categorizes the global metaverse in the e-commerce market as a part of the global information technology (IT) spending market. Our research report has extensively covered external factors influencing the parent market growth potential in the coming years, which will determine the levels of growth of the metaverse in the e-commerce market during the forecast period.

For more highlights on the parent market analysis –Grab a sample now!
Metaverse in E-commerce Market – Key Market Dynamics:
- Major Driver – The key factor driving growth in the metaverse in the e-commerce market is the growing popularity of AR technology. The rising popularity of AR technology allows consumers to be completely confident in a product’s quality and fit before purchasing it. This benefits customers in terms of convenience, but it also benefits merchants by reducing returns and expanding their customer base. Virtual purchasing experiences are becoming increasingly popular among customers. As a result, all types of e-commerce businesses should follow the trend. The addition of metaverse to an already inventive arena will provide the e-commerce business with something unparalleled. Customers will be able to make purchases in real-time in more lifelike virtual stores created by sellers. Such factors will contribute to the market growth during the forecast period.
- Major Challenges – The privacy and security concerns over metaverse will be a major challenge for the metaverse in the e-commerce market during the forecast period. Even though companies and organizations keep revolutionizing their IT security systems, data privacy and security has been a long-running concern for users of the metaverse. The metaverse collects and processes vast amounts of information about users and their environment. Privacy concerns, therefore, constitute a significant challenge in the market. Metaverse has access to users’ personal information, which could compromise their privacy. It has the ability to gather a lot of data from the user’s social networking accounts. If hackers obtain access to a user’s device, their privacy may be threatened. A security or privacy violation might lead to trouble and ruin the organizer’s reputation. Such factors may hamper the growth of the market during the forecast period.
To learn about additional key drivers, trends, and challenges – Request a Sample Report right now!
Metaverse in E-commerce Market – Segmentation Analysis:
The metaverse in the e-commerce market report is segmented by Geography (North America, APAC, Europe, South America, and the Middle East and Africa) and Platform ( Computer, Mobile, and Headset)
- Regional Highlights – 38% of the market’s growth will originate from North America during the forecast period. The US is the key market for metaverse in e-commerce in North America. Market growth in this region will be faster than the growth of the market in the South American and MEA regions.
- Revenue Generating Segment – The metaverse in e-commerce market share growth by the computer segment will be significant during the forecast period. The emergence of a metaverse in e-commerce has provided a highly personalized digital experience.
Grab a sample report for additional insights into the contribution of all the segments & regional opportunities
Metaverse in E-commerce Market – Vendor Analysis:
The metaverse in the e-commerce market is fragmented and the vendors are deploying growth strategies such as focusing on acquiring smaller brands to increase their market presence to compete in the market.
- Adobe Inc.
- Alibaba Group Holding Ltd.
- Amazon.com Inc.
- Autodesk Inc.
- Block Inc.
- Dealskart Online Services Pvt. Ltd.
- Epic Games Inc.
- Matterport Inc.
- Meta Platforms Inc.
- Microsoft Corp.
- NVIDIA Corp.
- Roblox Corp
- Salesforce.com Inc.
- SAP SE
- Shopify Inc.
- Unity Software Inc.
- To gain access to more vendor profiles with their key offerings available with Technavio, Click Here
The competitive scenario provided in the Metaverse In E-commerce Market report analyzes, evaluates, and positions companies based on various performance indicators. Some of the factors considered for this analysis include the financial performance of companies over the past few years, growth strategies, product innovations, new product launches, investments, growth in market share, etc. Don’t wait, Make a strategic approach & boost your business goals with our Metaverse In E-commerce Market Forecast Report – Buy Now!
Related Reports:
- The predicted growth of the metaverse in healthcare market share from 2021 to 2026 is USD 3.80 billion at a progressing CAGR of 33.83%.
- The metaverse in fashion market share is expected to increase to USD 6.61 billion from 2021 to 2026, and the market’s growth momentum will accelerate at a CAGR of 36.47%.
|
Metaverse In E-commerce Market Scope |
|
|
Report Coverage |
Details |
|
Page number |
120 |
|
Base year |
2021 |
|
Forecast period |
2022-2026 |
|
Growth momentum & CAGR |
Accelerate at a CAGR of 36.47% |
|
Market growth 2022-2026 |
USD 60.47 billion |
|
Market structure |
Fragmented |
|
YoY growth (%) |
30.5 |
|
Regional analysis |
North America, APAC, Europe, South America, Middle East, and Africa |
|
Performing market contribution |
North America at 38% |
|
Key consumer countries |
US, China, Japan, Germany, and UK |
|
Competitive landscape |
Leading companies, competitive strategies, consumer engagement scope |
|
Companies profiled |
Adobe Inc., Alibaba Group Holding Ltd., Amazon.com Inc., Autodesk Inc., Block Inc., Dealskart Online Services Pvt. Ltd., Epic Games Inc., Matterport Inc., Meta Platforms Inc., Microsoft Corp., NVIDIA Corp., Roblox Corp, Salesforce.com Inc., SAP SE, Shopify Inc., and Unity Software Inc. |
|
Market Dynamics |
Parent market analysis, Market growth inducers and obstacles, Fast-growing and slow-growing segment analysis, COVID 19 impact and future consumer dynamics, and market condition analysis for the forecast period. |
|
Customization purview |
If our report has not included the data that you are looking for, you can reach out to our analysts and get segments customized. |
Browse for Technavio “Information Technology Market” Research Reports
Key Topics Covered:
1 Executive Summary
- 1.1 Market Overview
- Exhibit 01: Executive Summary – Chart on Market Overview
- Exhibit 02: Executive Summary – Data Table on Market Overview
- Exhibit 03: Executive Summary – Chart on Global Market Characteristics
- Exhibit 04: Executive Summary – Chart on Market by Geography
- Exhibit 05: Executive Summary – Chart on Market Segmentation by Platform
- Exhibit 06: Executive Summary – Chart on Incremental Growth
- Exhibit 07: Executive Summary – Data Table on Incremental Growth
- Exhibit 08: Executive Summary – Chart on Vendor Market Positioning
2 Market Landscape
- 2.1 Market ecosystem
- Exhibit 09: Parent market
- Exhibit 10: Market Characteristics
3 Market Sizing
- 3.1 Market definition
- Exhibit 11: Offerings of vendors included in the market definition
- 3.2 Market segment analysis
- Exhibit 12: Market segments
- 3.3 Market size 2021
- 3.4 Market outlook: Forecast for 2021-2026
- Exhibit 13: Chart on Global – Market size and forecast 2021-2026 ($ million)
- Exhibit 14: Data Table on Global – Market size and forecast 2021-2026 ($ million)
- Exhibit 15: Chart on Global Market: Year-over-year growth 2021-2026 (%)
- Exhibit 16: Data Table on Global Market: Year-over-year growth 2021-2026 (%)
4 Five Forces Analysis
- 4.1 Five forces summary
- Exhibit 17: Five forces analysis – Comparison between 2021 and 2026
- 4.2 Bargaining power of buyers
- Exhibit 18: Chart on the Bargaining power of buyers – Impact of key factors 2021 and 2026
- 4.3 Bargaining power of suppliers
- Exhibit 19: Bargaining power of suppliers – Impact of key factors in 2021 and 2026
- 4.4 Threat of new entrants
- Exhibit 20: Threat of new entrants – Impact of key factors in 2021 and 2026
- 4.5 Threat of substitutes
- Exhibit 21: Threat of substitutes – Impact of key factors in 2021 and 2026
- 4.6 Threat of rivalry
- Exhibit 22: Threat of rivalry – Impact of key factors in 2021 and 2026
- 4.7 Market condition
- Exhibit 23: Chart on Market condition – Five forces 2021 and 2026
5 Market Segmentation by Platform
- 5.1 Market segments
- Exhibit 24: Chart on Platform – Market share 2021-2026 (%)
- Exhibit 25: Data Table on Platform – Market share 2021-2026 (%)
- 5.2 Comparison by Platform
- Exhibit 26: Chart on Comparison by Platform
- Exhibit 27: Data Table on Comparison by Platform
- 5.3 Computer – Market size and forecast 2021-2026
- Exhibit 28: Chart on Computer – Market size and forecast 2021-2026 ($ million)
- Exhibit 29: Data Table on Computer – Market size and forecast 2021-2026 ($ million)
- Exhibit 30: Chart on Computer – Year-over-year growth 2021-2026 (%)
- Exhibit 31: Data Table on Computer – Year-over-year growth 2021-2026 (%)
- 5.4 Mobile – Market size and forecast 2021-2026
- Exhibit 32: Chart on Mobile – Market size and forecast 2021-2026 ($ million)
- Exhibit 33: Data Table on Mobile – Market size and forecast 2021-2026 ($ million)
- Exhibit 34: Chart on Mobile – Year-over-year growth 2021-2026 (%)
- Exhibit 35: Data Table on Mobile – Year-over-year growth 2021-2026 (%)
- 5.5 Headset – Market size and forecast 2021-2026
- Exhibit 36: Chart on Headset – Market size and forecast 2021-2026 ($ million)
- Exhibit 37: Data Table on Headset – Market size and forecast 2021-2026 ($ million)
- Exhibit 38: Chart on Headset – Year-over-year growth 2021-2026 (%)
- Exhibit 39: Data Table on Headset – Year-over-year growth 2021-2026 (%)
- 5.6 Market opportunity by Platform
- Exhibit 40: Market opportunity by Platform ($ million)
6 Customer Landscape
- 6.1 Customer landscape overview
- Exhibit 41: Analysis of price sensitivity, lifecycle, customer purchase basket, adoption rates, and purchase criteria
7 Geographic Landscape
- 7.1 Geographic segmentation
- Exhibit 42: Chart on Market share by geography 2021-2026 (%)
- Exhibit 43: Data Table on Market share by geography 2021-2026 (%)
- 7.2 Geographic comparison
- Exhibit 44: Chart on Geographic comparison
- Exhibit 45: Data Table on Geographic comparison
- 7.3 North America – Market size and forecast 2021-2026
- Exhibit 46: Chart on North America – Market size and forecast 2021-2026 ($ million)
- Exhibit 47: Data Table on North America – Market size and forecast 2021-2026 ($ million)
- Exhibit 48: Chart on North America – Year-over-year growth 2021-2026 (%)
- Exhibit 49: Data Table on North America – Year-over-year growth 2021-2026 (%)
- 7.4 APAC – Market size and forecast 2021-2026
- Exhibit 50: Chart on APAC – Market size and forecast 2021-2026 ($ million)
- Exhibit 51: Data Table on APAC – Market size and forecast 2021-2026 ($ million)
- Exhibit 52: Chart on APAC – Year-over-year growth 2021-2026 (%)
- Exhibit 53: Data Table on APAC – Year-over-year growth 2021-2026 (%)
- 7.5 Europe – Market size and forecast 2021-2026
- Exhibit 54: Chart on Europe – Market size and forecast 2021-2026 ($ million)
- Exhibit 55: Data Table on Europe – Market size and forecast 2021-2026 ($ million)
- Exhibit 56: Chart on Europe – Year-over-year growth 2021-2026 (%)
- Exhibit 57: Data Table on Europe – Year-over-year growth 2021-2026 (%)
- 7.6 South America – Market size and forecast 2021-2026
- Exhibit 58: Chart on South America – Market size and forecast 2021-2026 ($ million)
- Exhibit 59: Data Table on South America – Market size and forecast 2021-2026 ($ million)
- Exhibit 60: Chart on South America – Year-over-year growth 2021-2026 (%)
- Exhibit 61: Data Table on South America – Year-over-year growth 2021-2026 (%)
- 7.7 The Middle East and Africa – Market size and forecast 2021-2026
- Exhibit 62: Chart on the Middle East and Africa – Market size and forecast 2021-2026 ($ million)
- Exhibit 63: Data Table on the Middle East and Africa – Market size and forecast 2021-2026 ($ million)
- Exhibit 64: Chart on the Middle East and Africa – Year-over-year growth 2021-2026 (%)
- Exhibit 65: Data Table on the Middle East and Africa – Year-over-year growth 2021-2026 (%)
- 7.8 US – Market size and forecast 2021-2026
- Exhibit 66: Chart on the US – Market size and forecast 2021-2026 ($ million)
- Exhibit 67: Data Table on the US – Market size and forecast 2021-2026 ($ million)
- Exhibit 68: Chart on US – Year-over-year growth 2021-2026 (%)
- Exhibit 69: Data Table on the US – Year-over-year growth 2021-2026 (%)
- 7.9 China – Market size and forecast 2021-2026
- Exhibit 70: Chart on China – Market size and forecast 2021-2026 ($ million)
- Exhibit 71: Data Table on China – Market size and forecast 2021-2026 ($ million)
- Exhibit 72: Chart on China – Year-over-year growth 2021-2026 (%)
- Exhibit 73: Data Table on China – Year-over-year growth 2021-2026 (%)
- 7.10 Germany – Market size and forecast 2021-2026
- Exhibit 74: Chart on Germany – Market size and forecast 2021-2026 ($ million)
- Exhibit 75: Data Table on Germany – Market size and forecast 2021-2026 ($ million)
- Exhibit 76: Chart on Germany – Year-over-year growth 2021-2026 (%)
- Exhibit 77: Data Table on Germany – Year-over-year growth 2021-2026 (%)
- 7.11 UK – Market size and forecast 2021-2026
- Exhibit 78: Chart on UK – Market size and forecast 2021-2026 ($ million)
- Exhibit 79: Data Table on UK – Market size and forecast 2021-2026 ($ million)
- Exhibit 80: Chart on UK – Year-over-year growth 2021-2026 (%)
- Exhibit 81: Data Table on UK – Year-over-year growth 2021-2026 (%)
- 7.12 Japan – Market size and forecast 2021-2026
- Exhibit 82: Chart on Japan – Market size and forecast 2021-2026 ($ million)
- Exhibit 83: Data Table on Japan – Market size and forecast 2021-2026 ($ million)
- Exhibit 84: Chart on Japan – Year-over-year growth 2021-2026 (%)
- Exhibit 85: Data Table on Japan – Year-over-year growth 2021-2026 (%)
- 7.13 Market opportunity by geography
- Exhibit 86: Market opportunity by geography ($ million)
8 Drivers, Challenges, and Trends
- 8.1 Market drivers
- 8.2 Market challenges
- 8.3 Impact of drivers and challenges
- Exhibit 87: Impact of drivers and challenges in 2021 and 2026
- 8.4 Market trends
9 Vendor Landscape
- 9.1 Overview
- 9.2 Vendor landscape
- Exhibit 88: Overview on Criticality of inputs and Factors of differentiation
- 9.3 Landscape disruption
- Exhibit 89: Overview on factors of disruption
- 9.4 Industry risks
- Exhibit 90: Impact of key risks on business
10 Vendor Analysis
- 10.1 Vendors covered
- Exhibit 91: Vendors covered
- 10.2 Market positioning of vendors
- Exhibit 92: Matrix on vendor position and classification
- 10.3 Alibaba Group Holding Ltd.
- Exhibit 93: Alibaba Group Holding Ltd. – Overview
- Exhibit 94: Alibaba Group Holding Ltd. – Business segments
- Exhibit 95: Alibaba Group Holding Ltd. – Key offerings
- Exhibit 96: Alibaba Group Holding Ltd. – Segment focus
- 10.4 Autodesk Inc.
- Exhibit 97: Autodesk Inc. – Overview
- Exhibit 98: Autodesk Inc. – Business segments
- Exhibit 99: Autodesk Inc. – Key news
- Exhibit 100: Autodesk Inc. – Key offerings
- Exhibit 101: Autodesk Inc. – Segment focus
- 10.5 Block Inc.
- Exhibit 102: Block Inc. – Overview
- Exhibit 103: Block Inc. – Business segments
- Exhibit 104: Block Inc. – Key offerings
- Exhibit 105: Block Inc. – Segment focus
- 10.6 Meta Platforms Inc.
- Exhibit 106: Meta Platforms Inc. – Overview
- Exhibit 107: Meta Platforms Inc. – Business segments
- Exhibit 108: Meta Platforms Inc. – Key news
- Exhibit 109: Meta Platforms Inc. – Key offerings
- Exhibit 110: Meta Platforms Inc. – Segment focus
- 10.7 Microsoft Corp.
- Exhibit 111: Microsoft Corp. – Overview
- Exhibit 112: Microsoft Corp. – Business segments
- Exhibit 113: Microsoft Corp. – Key news
- Exhibit 114: Microsoft Corp. – Key offerings
- Exhibit 115: Microsoft Corp. – Segment focus
- 10.8 NVIDIA Corp.
- Exhibit 116: NVIDIA Corp. – Overview
- Exhibit 117: NVIDIA Corp. – Business segments
- Exhibit 118: NVIDIA Corp. – Key news
- Exhibit 119: NVIDIA Corp. – Key offerings
- Exhibit 120: NVIDIA Corp. – Segment focus
- 10.9 Roblox Corp
- Exhibit 121: Roblox Corp – Overview
- Exhibit 122: Roblox Corp – Product / Service
- Exhibit 123: Roblox Corp – Key offerings
- 10.10 Salesforce.com Inc.
- Exhibit 124: Salesforce.com Inc. – Overview
- Exhibit 125: Salesforce.com Inc. – Product / Service
- Exhibit 126: Salesforce.com Inc. – Key news
- Exhibit 127: Salesforce.com Inc. – Key offerings
- 10.11 Shopify Inc.
- Exhibit 128: Shopify Inc. – Overview
- Exhibit 129: Shopify Inc. – Product / Service
- Exhibit 130: Shopify Inc. – Key offerings
- 10.12 Unity Software Inc.
- Exhibit 131: Unity Software Inc. – Overview
- Exhibit 132: Unity Software Inc. – Product / Service
- Exhibit 133: Unity Software Inc. – Key offerings
11 Appendix
- 11.1 Scope of the report
- 11.2 Inclusions and exclusions checklist
- Exhibit 134: Inclusions checklist
- Exhibit 135: Exclusions checklist
- 11.3 Currency conversion rates for US$
- Exhibit 136: Currency conversion rates for US$
- 11.4 Research methodology
- Exhibit 137: Research methodology
- Exhibit 138: Validation techniques employed for market sizing
- Exhibit 139: Information sources
- 11.5 List of abbreviations
- Exhibit 140: List of abbreviations
Technavio is a leading global technology research and advisory company. Their research and analysis focus on emerging market trends and provide actionable insights to help businesses identify market opportunities and develop effective strategies to optimize their market positions. With over 500 specialized analysts, Technavio’s report library consists of more than 17,000 reports and counting, covering 800 technologies, spanning 50 countries. Their client base consists of enterprises of all sizes, including more than 100 Fortune 500 companies. This growing client base relies on Technavio’s comprehensive coverage, extensive research, and actionable market insights to identify opportunities in existing and potential markets and assess their competitive positions within changing market scenarios.
Contact
Technavio Research
Jesse Maida
Media & Marketing Executive
US: +1 844 364 1100
UK: +44 203 893 3200
Email:media@technavio.com
Website: www.technavio.com/
![]()
![]() View original content to download multimedia:https://www.prnewswire.com/news-releases/metaverse-in-e-commerce-market-to-record-a-30-5-y-o-y-growth-rate-in-2022–driven-by-growing-popularity-of-ar-technology—17000-technavio-reports-301597029.html
View original content to download multimedia:https://www.prnewswire.com/news-releases/metaverse-in-e-commerce-market-to-record-a-30-5-y-o-y-growth-rate-in-2022–driven-by-growing-popularity-of-ar-technology—17000-technavio-reports-301597029.html
SOURCE Technavio

Source link
The content is by PR Newswire. Headlines of Today Media is not responsible for the content provided or any links related to this content. Headlines of Today Media is not responsible for the correctness, topicality or the quality of the content.