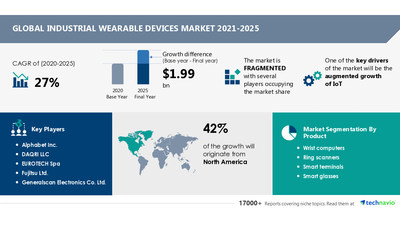
NEW YORK, June 20, 2022 /PRNewswire/ — The Industrial Wearable Devices Market is segmented by Geography (North America, Europe, APAC, South America, and MEA). 42% of the market’s growth will originate from North America during the forecast period. US is the key market for industrial wearable devices in North America. Market growth in this region will be faster than the growth of the market in other regions. Increase in the adoption of industrial wearable devices in operational activities will facilitate the industrial wearable devices market growth in North America over the forecast period. For instance, Ford uses Microsoft’s HoloLens to design AR-based cars. Vendors witness accelerated demand from the region and are manufacturing advanced wearable devices to cater to the rising demand.

Track Pricing, Supply, Demand, Trade, and Distribution Scenario along with Key Customers. View at Special Pricing
The Industrial Wearable Devices Market value is set to grow by USD 1.99 billion from 2020 to 2025, as per the latest report by Technavio. Moreover, one of the key factors driving the market growth is the augmented growth of IoT. IoT is one such avenue that captures data from the surrounding stimuli and ensures that various products are connected. IoT and smart products have created revolutionizing expectations about data and connectivity while opening new channels of business value. One such channel is the creation of industrial wearable devices. Industrial wearable devices include the use of connected devices such as smart glasses, wrist computers, ring scanners, and wearable scanners that are used by industrial workers across various end-user industries. The growth of the global IoT market is a major driver of the global industrial wearable devices market. The prices of hardware and electronics are continuing to fall in the global market. As a result, connectivity costs and embedded sensors no longer deter companies from adopting smart technology. Many companies are adopting sensors and IoT connectivity to yield greater value not only by promising data but also by providing better safety and long-term cost savings through active prevention of accidents. Though these products measure and react, they ultimately protect the individual and prevent health issues and tragic situations in a broader sense.
|
Industrial Wearable Devices Market Scope |
|
|
Report Coverage |
Details |
|
Page number |
120 |
|
Base year |
2020 |
|
Forecast period |
2021-2025 |
|
Growth momentum & CAGR |
Decelerate at a CAGR of 27% |
|
Market growth 2021-2025 |
$ 1.99 billion |
|
Market structure |
Fragmented |
|
YoY growth (%) |
34.47 |
|
Regional analysis |
North America, Europe, APAC, South America, MEA |
|
Performing market contribution |
North America at 42% |
|
Key consumer countries |
US, Germany, China, and Japan |
|
Competitive landscape |
Leading companies, competitive strategies, consumer engagement scope |
|
Companies profiled |
Alphabet Inc., DAQRI LLC, EUROTECH Spa, Fujitsu Ltd., Generalscan Electronics Co. Ltd., Honeywell International Inc., Lenovo Group Ltd., Magic Leap Inc., Microsoft Corp., and OM Digital Solutions Corp. |
|
Market Dynamics |
Parent market analysis, Market growth inducers and obstacles, Fast-growing and slow-growing segment analysis, COVID 19 impact and future consumer dynamics, market condition analysis for the forecast period, |
|
Customization preview |
If our report has not included the data that you are looking for, you can reach out to our analysts and get segments customized. |
The Industrial Wearable Devices Market is segmented by product (wrist computers, ring scanners, smart terminals, and smart glasses), end-user (transportation and logistics, retail, manufacturing, healthcare, and others), and application (warehouse management, training and simulation, and service and maintenance).
- Product
- Wrist Computers
- Ring Scanners
- Smart Terminals
- Smart Glasses
The industrial wearable devices market share growth by the wrist computers will be significant during the forecast period. Wrist computers help enhance mobility among workers, mainly in the logistics industry. The driving factor for their increased adoption is the automation and the need for reducing human intervention in the industry.
- End User
- Transportation and Logistics
- Retail
- Manufacturing
- Healthcare
- Others
- Application
- Warehouse Management
- Training and Simulation
- Service and Maintenance
The Report also Covers the Following Areas:
- Industrial Wearable Devices Market size
- Industrial Wearable Devices Market trends
- Industrial Wearable Devices Market analysis
Industrial Wearable Devices Market 2021-2025: Vendor Analysis and Scope
The report analyzes the market’s competitive landscape and offers information on several market vendors, including:
- Alphabet Inc.
- DAQRI LLC
- EUROTECH Spa
- Fujitsu Ltd.
- Generalscan Electronics Co. Ltd.
- Honeywell International Inc.
- Lenovo Group Ltd.
- Magic Leap Inc.
- Microsoft Corp.
- OM Digital Solutions Corp.
The industrial wearable devices market is fragmented and the vendors are deploying growth strategies such as pricing and marketing strategies to compete in the market.
Industrial Wearable Devices Market 2021-2025: Key Highlights
- CAGR of the market during the forecast period 2021-2025
- Detailed information on factors that will assist industrial wearable devices market growth during the next five years
- Estimation of the industrial wearable devices market size and its contribution to the parent market
- Predictions on upcoming trends and changes in consumer behavior
- The growth of the industrial wearable devices market
- Analysis of the market’s competitive landscape and detailed information on vendors
- Comprehensive details of factors that will challenge the growth of industrial wearable devices market vendors
Wearable Technology Market by Product and Geography – Forecast and Analysis 2020-2024: The wearable technology market size has the potential to grow by USD 35.48 billion during 2020-2024, and the market’s growth momentum will accelerate during the forecast period because of the steady increase in year-over-year growth. Find More Exclusive Research Insights Here
Medical Device Security Solutions Market by Device and Geography – Forecast and Analysis 2020-2024: The global medical device security solutions market has the potential to grow by USD 301.04 million during 2020-2024, and the market’s growth momentum will accelerate throughout the forecast period because of the steady increase in year-over-year growth. Find More Exclusive Research Insights Here
1 Executive Summary
2 Market Landscape
- 2.1 Market ecosystem
- Exhibit 01: Parent market
- Exhibit 02: Market characteristics
- 2.2 Value chain analysis
- Exhibit 03: Value Chain Analysis: Consumer electronics
3 Market Sizing
- 3.1 Market definition
- Exhibit 04: Offerings of vendors included in the market definition
- 3.2 Market segment analysis
- Exhibit 05: Market segments
- 3.3 Market size 2020
- 3.4 Market outlook: Forecast for 2020 – 2025
- Exhibit 06: Global – Market size and forecast 2020 – 2025 ($ million)
- Exhibit 07: Global market: Year-over-year growth 2020 – 2025 (%)
4 Five Forces Analysis
- 4.1 Five forces summary
- Exhibit 08: Five forces analysis 2020 & 2025
- 4.2 Bargaining power of buyers
- Exhibit 09: Bargaining power of buyers
- 4.3 Bargaining power of suppliers
- Exhibit 10: Bargaining power of suppliers
- 4.4 Threat of new entrants
- Exhibit 11: Threat of new entrants
- 4.5 Threat of substitutes
- Exhibit 12: Threat of substitutes
- 4.6 Threat of rivalry
- Exhibit 13: Threat of rivalry
- 4.7 Market condition
- Exhibit 14: Market condition – Five forces 2020
5 Market Segmentation by Product
- 5.1 Market segments
- Exhibit 15: Product – Market share 2020-2025 (%)
- 5.2 Comparison by Product
- Exhibit 16: Comparison by Product
- 5.3 Wrist computers – Market size and forecast 2020-2025
- Exhibit 17: Wrist computers – Market size and forecast 2020-2025 ($ million)
- Exhibit 18: Wrist computers – Year-over-year growth 2020-2025 (%)
- 5.4 Ring scanners – Market size and forecast 2020-2025
- Exhibit 19: Ring scanners – Market size and forecast 2020-2025 ($ million)
- Exhibit 20: Ring scanners – Year-over-year growth 2020-2025 (%)
- 5.5 Smart terminals – Market size and forecast 2020-2025
- Exhibit 21: Smart terminals – Market size and forecast 2020-2025 ($ million)
- Exhibit 22: Smart terminals – Year-over-year growth 2020-2025 (%)
- 5.6 Smart glasses – Market size and forecast 2020-2025
- Exhibit 23: Smart glasses – Market size and forecast 2020-2025 ($ million)
- Exhibit 24: Smart glasses – Year-over-year growth 2020-2025 (%)
- 5.7 Market opportunity by Product
- Exhibit 25: Market opportunity by Product
6 Market Segmentation by Application
- 6.1 Market segments
- Exhibit 26: Application – Market share 2020-2025 (%)
- 6.2 Comparison by Application
- Exhibit 27: Comparison by Application
- 6.3 Warehouse management – Market size and forecast 2020-2025
- Exhibit 28: Warehouse management – Market size and forecast 2020-2025 ($ million)
- Exhibit 29: Warehouse management – Year-over-year growth 2020-2025 (%)
- 6.4 Training and simulation – Market size and forecast 2020-2025
- Exhibit 30: Training and simulation – Market size and forecast 2020-2025 ($ million)
- Exhibit 31: Training and simulation – Year-over-year growth 2020-2025 (%)
- 6.5 Service and maintenance – Market size and forecast 2020-2025
- Exhibit 32: Service and maintenance – Market size and forecast 2020-2025 ($ million)
- Exhibit 33: Service and maintenance – Year-over-year growth 2020-2025 (%)
- 6.6 Market opportunity by Application
- Exhibit 34: Market opportunity by Application
7 Market Segmentation by End-user
- 7.1 Market segments
- Exhibit 35: End user – Market share 2020-2025 (%)
- 7.2 Comparison by End user
- Exhibit 36: Comparison by End user
- 7.3 Transportation and logistics – Market size and forecast 2020-2025
- Exhibit 37: Transportation and logistics – Market size and forecast 2020-2025 ($ million)
- Exhibit 38: Transportation and logistics – Year-over-year growth 2020-2025 (%)
- 7.4 Retail – Market size and forecast 2020-2025
- Exhibit 39: Retail – Market size and forecast 2020-2025 ($ million)
- Exhibit 40: Retail – Year-over-year growth 2020-2025 (%)
- 7.5 Manufacturing – Market size and forecast 2020-2025
- Exhibit 41: Manufacturing – Market size and forecast 2020-2025 ($ million)
- Exhibit 42: Manufacturing – Year-over-year growth 2020-2025 (%)
- 7.6 Healthcare – Market size and forecast 2020-2025
- Exhibit 43: Healthcare – Market size and forecast 2020-2025 ($ million)
- Exhibit 44: Healthcare – Year-over-year growth 2020-2025 (%)
- 7.7 Others – Market size and forecast 2020-2025
- Exhibit 45: Others – Market size and forecast 2020-2025 ($ million)
- Exhibit 46: Others – Year-over-year growth 2020-2025 (%)
- 7.8 Market opportunity by End user
- Exhibit 47: Market opportunity by End user
8 Customer landscape
9 Geographic Landscape
- 9.1 Geographic segmentation
- Exhibit 49: Market share by geography 2020-2025 (%)
- 9.2 Geographic comparison
- Exhibit 50: Geographic comparison
- 9.3 North America – Market size and forecast 2020-2025
- Exhibit 51: North America – Market size and forecast 2020-2025 ($ million)
- Exhibit 52: North America – Year-over-year growth 2020-2025 (%)
- 9.4 Europe – Market size and forecast 2020-2025
- Exhibit 53: Europe – Market size and forecast 2020-2025 ($ million)
- Exhibit 54: Europe – Year-over-year growth 2020-2025 (%)
- 9.5 APAC – Market size and forecast 2020-2025
- Exhibit 55: APAC – Market size and forecast 2020-2025 ($ million)
- Exhibit 56: APAC – Year-over-year growth 2020-2025 (%)
- 9.6 South America – Market size and forecast 2020-2025
- Exhibit 57: South America – Market size and forecast 2020-2025 ($ million)
- Exhibit 58: South America – Year-over-year growth 2020-2025 (%)
- 9.7 MEA – Market size and forecast 2020-2025
- Exhibit 59: MEA – Market size and forecast 2020-2025 ($ million)
- Exhibit 60: MEA – Year-over-year growth 2020-2025 (%)
- 9.8 Key leading countries
- Exhibit 61: Key leading countries
- 9.9 Market opportunity by geography
- Exhibit 62: Market opportunity by geography
10 Drivers, Challenges, and Trends
- 10.1 Market drivers
- 10.2 Market challenges
- Exhibit 63: Impact of drivers and challenges
- 10.3 Market trends
11 Vendor Landscape
- 11.1 Vendor landscape
- Exhibit 64: Vendor landscape
- 11.2 Landscape disruption
- Exhibit 65: Landscape disruption
- Exhibit 66: Industry risks
- 11.3 Competitive Scenario
12 Vendor Analysis
- 12.1 Vendors covered
- Exhibit 67: Vendors covered
- 12.2 Market positioning of vendors
- Exhibit 68: Market positioning of vendors
- 12.3 Alphabet Inc.
- Exhibit 69: Alphabet Inc. – Overview
- Exhibit 70: Alphabet Inc. – Business segments
- Exhibit 71: Alphabet Inc. – Key offerings
- Exhibit 72: Alphabet Inc. – Segment focus
- 12.4 DAQRI LLC
- Exhibit 73: DAQRI LLC – Overview
- Exhibit 74: DAQRI LLC – Product and service
- Exhibit 75: DAQRI LLC – Key offerings
- 12.5 EUROTECH Spa
- Exhibit 76: EUROTECH Spa – Overview
- Exhibit 77: EUROTECH Spa – Business segments
- Exhibit 78: EUROTECH Spa – Key offerings
- Exhibit 79: EUROTECH Spa – Segment focus
- 12.6 Fujitsu Ltd.
- Exhibit 80: Fujitsu Ltd. – Overview
- Exhibit 81: Fujitsu Ltd. – Business segments
- Exhibit 82: Fujitsu Ltd. – Key news
- Exhibit 83: Fujitsu Ltd. – Key offerings
- Exhibit 84: Fujitsu Ltd. – Segment focus
- 12.7 Generalscan Electronics Co. Ltd.
- Exhibit 85: Generalscan Electronics Co. Ltd. – Overview
- Exhibit 86: Generalscan Electronics Co. Ltd. – Product and service
- Exhibit 87: Generalscan Electronics Co. Ltd. – Key offerings
- 12.8 Honeywell International Inc.
- Exhibit 88: Honeywell International Inc. – Overview
- Exhibit 89: Honeywell International Inc. – Business segments
- Exhibit 90: Honeywell International Inc. – Key news
- Exhibit 91: Honeywell International Inc. – Key offerings
- Exhibit 92: Honeywell International Inc. – Segment focus
- 12.9 Lenovo Group Ltd.
- Exhibit 93: Lenovo Group Ltd. – Overview
- Exhibit 94: Lenovo Group Ltd. – Business segments
- Exhibit 95: Lenovo Group Ltd. – Key news
- Exhibit 96: Lenovo Group Ltd. – Key offerings
- Exhibit 97: Lenovo Group Ltd. – Segment focus
- 12.10 Magic Leap Inc.
- Exhibit 98: Magic Leap Inc. – Overview
- Exhibit 99: Magic Leap Inc. – Product and service
- Exhibit 100: Magic Leap Inc. – Key offerings
- 12.11 Microsoft Corp.
- Exhibit 101: Microsoft Corp. – Overview
- Exhibit 102: Microsoft Corp. – Business segments
- Exhibit 103: Microsoft Corp. – Key offerings
- Exhibit 104: Microsoft Corp. – Segment focus
- 12.12 OM Digital Solutions Corp.
- Exhibit 105: OM Digital Solutions Corp. – Overview
- Exhibit 106: OM Digital Solutions Corp. – Product and service
- Exhibit 107: OM Digital Solutions Corp. – Key offerings
13 Appendix
- 13.1 Scope of the report
- 13.2 Currency conversion rates for US$
- Exhibit 108: Currency conversion rates for US$
- 13.3 Research methodology
- Exhibit 109: Research Methodology
- Exhibit 110: Validation techniques employed for market sizing
- Exhibit 111: Information sources
- 13.4 List of abbreviations
- Exhibit 112: List of abbreviations
Technavio is a leading global technology research and advisory company. Their research and analysis focus on emerging market trends and provides actionable insights to help businesses identify market opportunities and develop effective strategies to optimize their market positions. With over 500 specialized analysts, Technavio’s report library consists of more than 17,000 reports and counting, covering 800 technologies, spanning across 50 countries. Their client base consists of enterprises of all sizes, including more than 100 Fortune 500 companies. This growing client base relies on Technavio’s comprehensive coverage, extensive research, and actionable market insights to identify opportunities in existing and potential markets and assess their competitive positions within changing market scenarios.
Contact
Technavio Research
Jesse Maida
Media & Marketing Executive
US: +1 844 364 1100
UK: +44 203 893 3200
Email: media@technavio.com
Website: www.technavio.com/
![]()
![]() View original content to download multimedia:https://www.prnewswire.com/news-releases/industrial-wearable-devices-market-by-product-end-user-application-and-geography–global-forecast-to-2025-301570510.html
View original content to download multimedia:https://www.prnewswire.com/news-releases/industrial-wearable-devices-market-by-product-end-user-application-and-geography–global-forecast-to-2025-301570510.html
SOURCE Technavio

Source link
The content is by PR Newswire. Headlines of Today Media is not responsible for the content provided or any links related to this content. Headlines of Today Media is not responsible for the correctness, topicality or the quality of the content.