NEW YORK, June 3, 2022 /PRNewswire/ — One of the key trends in the industrial vacuum pump market growth is the rise in the electrification of mechanical components. Electric power steering (EPS) responds more quickly and efficiently. It uses software such as parking assistance and lane-change assists. In EPS, steering wheel movements are converted into electronic signals. These signals control the electric motors responsible for moving the wheels. Such advantages are expected to drive market growth during the forecast period.

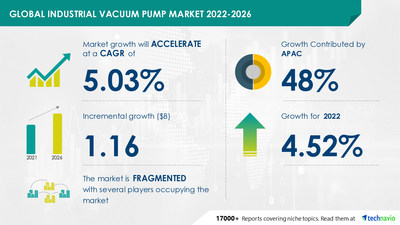
The industrial vacuum pump market size is expected to grow by USD 1.16 billion from 2021 to 2026. Moreover, the growth momentum of the market will accelerate at a CAGR of 5.03% during the forecast period.
Request Latest Sample Report to learn more about market trends
The increasingly stringent regulations in the food and beverage and pharmaceutical industries are driving the industrial vacuum pump market growth. Regulatory agencies impose high penalties and advise product recalls if product quality, hygiene, and cleanliness are not maintained. For instance, the US FDA has advised pharmaceutical manufacturers to adopt measures and protocols to prevent water-borne contaminants in their production processes.
The industrial vacuum pump market report covers the following areas:
- Industrial Vacuum Pump Market Size
- Industrial Vacuum Pump Market Trends
- Industrial Vacuum Pump Market Industry Analysis
Subscribe to our “Basic Plan” billed annually at USD 5000. Get lifetime access to our Technavio Insights
The industrial vacuum pump market is fragmented. Vendors are deploying growth strategies such as product differentiation through technological innovations to compete in the market. The global industrial vacuum pump market has some well-established players that design and manufacture industrial vacuum pumps for various applications such as automotive, food and beverages, and oil and gas. Prominent vendors are making use of advanced materials solutions and technology to improve the working efficiency of industrial vacuum pumps and related components.
Agilent Technologies Inc., Atlas Copco AB, Becker Pumps Corp., Busch Dienste GmbH, Cutes Corp., Dekker Vacuum Technologies Inc., Ebara Corp., Graham Corp., IDEX Corp., Ingersoll Rand Inc., KNF DAC GmbH, OC Oerlikon Corp. AG, Pfeiffer Vacuum Technology AG, Samson Pump AS, Technika Chlodzenia Spolka z o.o., Tsurumi Manufacturing Co. Ltd., Tuthill Corp., ULVAC Inc., Vooner FloGard Corp., and PPI Pumps Pvt. Ltd. are among some of the major market participants.
For more insights into key vendors and their offerings, Download an Exclusive Sample Report
- End-user
- Semiconductor Industry
- Process Industry
- Power Industry
- Coating Industry
- Others
- Geography
- APAC
- North America
- Europe
- South America
- Middle East And Africa
- CAGR of the market during the forecast period 2022-2026
- Detailed information on factors that will assist industrial vacuum pump market growth during the next five years
- Estimation of the industrial vacuum pump market size and its contribution to the parent market
- Predictions on upcoming trends and changes in consumer behavior
- The growth of the industrial vacuum pump market
- Analysis of the market’s competitive landscape and detailed information on vendors
- Comprehensive details of factors that will challenge the growth of industrial vacuum pump market, vendors
Wind Turbine Generator Market by Application and Geography – Forecast and Analysis 2022-2026
Power to Gas Market by End-user and Geography – Forecast and Analysis 2022-2026
|
Industrial Vacuum Pump Market Scope |
|
|
Report Coverage |
Details |
|
Page number |
120 |
|
Base year |
2021 |
|
Forecast period |
2022-2026 |
|
Growth momentum & CAGR |
Accelerate at a CAGR of 5.03% |
|
Market growth 2022-2026 |
USD 1.16 billion |
|
Market structure |
Fragmented |
|
YoY growth (%) |
4.52 |
|
Regional analysis |
APAC, North America, Europe, South America, and Middle East and Africa |
|
Performing market contribution |
APAC at 48% |
|
Key consumer countries |
US, China, Japan, South Korea, and Germany |
|
Competitive landscape |
Leading companies, competitive strategies, consumer engagement scope |
|
Companies profiled |
Agilent Technologies Inc., Atlas Copco AB, Becker Pumps Corp., Busch Dienste GmbH, Cutes Corp., Dekker Vacuum Technologies Inc., Ebara Corp., Graham Corp., IDEX Corp., Ingersoll Rand Inc., KNF DAC GmbH, OC Oerlikon Corp. AG, Pfeiffer Vacuum Technology AG, Samson Pump AS, Technika Chlodzenia Spolka z o.o., Tsurumi Manufacturing Co. Ltd., Tuthill Corp., ULVAC Inc., Vooner FloGard Corp., and PPI Pumps Pvt. Ltd. |
|
Market Dynamics |
Parent market analysis, Market growth inducers and obstacles, Fast-growing and slow-growing segment analysis, COVID 19 impact and future consumer dynamics, market condition analysis for the forecast period, |
|
Customization purview |
If our report has not included the data that you are looking for, you can reach out to our analysts and get segments customized. |
1 Executive Summary
- 1.1 Market overview
- Exhibit 01: Executive Summary – Chart on Market Overview
- Exhibit 02: Executive Summary – Data Table on Market Overview
- Exhibit 03: Executive Summary – Chart on Global Market Characteristics
- Exhibit 04: Executive Summary – Chart on Market by Geography
- Exhibit 05: Executive Summary – Chart on Market Segmentation by End-user
- Exhibit 06: Executive Summary – Chart on Incremental Growth
- Exhibit 07: Executive Summary – Data Table on Incremental Growth
- Exhibit 08: Executive Summary – Chart on Vendor Market Positioning
2 Market Landscape
- 2.1 Market ecosystem
- Exhibit 09: Parent market
- Exhibit 10: Market Characteristics
3 Market Sizing
- 3.1 Market definition
- Exhibit 11: Offerings of vendors included in the market definition
- 3.2 Market segment analysis
- Exhibit 12: Market segments
- 3.3 Market size 2021
- 3.4 Market outlook: Forecast for 2021-2026
- Exhibit 13: Chart on Global – Market size and forecast 2021-2026 ($ million)
- Exhibit 14: Data Table on Global – Market size and forecast 2021-2026 ($ million)
- Exhibit 15: Chart on Global Market: Year-over-year growth 2021-2026 (%)
- Exhibit 16: Data Table on Global Market: Year-over-year growth 2021-2026 (%)
4 Five Forces Analysis
- 4.1 Five forces summary
- Exhibit 17: Five forces analysis – Comparison between 2021 and 2026
- 4.2 Bargaining power of buyers
- Exhibit 18: Bargaining power of buyers – Impact of key factors in 2021 and 2026
- 4.3 Bargaining power of suppliers
- Exhibit 19: Bargaining power of suppliers – Impact of key factors in 2021 and 2026
- 4.4 Threat of new entrants
- Exhibit 20: Threat of new entrants – Impact of key factors in 2021 and 2026
- 4.5 Threat of substitutes
- Exhibit 21: Threat of substitutes – Impact of key factors in 2021 and 2026
- 4.6 Threat of rivalry
- Exhibit 22: Threat of rivalry – Impact of key factors in 2021 and 2026
- 4.7 Market condition
- Exhibit 23: Chart on Market condition – Five forces 2021 and 2026
5 Market Segmentation by End-user
- 5.1 Market segments
- Exhibit 24: Chart on End-user – Market share 2021-2026 (%)
- Exhibit 25: Data Table on End-user – Market share 2021-2026 (%)
- 5.2 Comparison by End-user
- Exhibit 26: Chart on Comparison by End-user
- Exhibit 27: Data Table on Comparison by End-user
- 5.3 Semiconductor industry – Market size and forecast 2021-2026
- Exhibit 28: Chart on Semiconductor industry – Market size and forecast 2021-2026 ($ million)
- Exhibit 29: Data Table on Semiconductor industry – Market size and forecast 2021-2026 ($ million)
- Exhibit 30: Chart on Semiconductor industry – Year-over-year growth 2021-2026 (%)
- Exhibit 31: Data Table on Semiconductor industry – Year-over-year growth 2021-2026 (%)
- 5.4 Process industry – Market size and forecast 2021-2026
- Exhibit 32: Chart on Process industry – Market size and forecast 2021-2026 ($ million)
- Exhibit 33: Data Table on Process industry – Market size and forecast 2021-2026 ($ million)
- Exhibit 34: Chart on Process industry – Year-over-year growth 2021-2026 (%)
- Exhibit 35: Data Table on Process industry – Year-over-year growth 2021-2026 (%)
- 5.5 Power industry – Market size and forecast 2021-2026
- Exhibit 36: Chart on Power industry – Market size and forecast 2021-2026 ($ million)
- Exhibit 37: Data Table on Power industry – Market size and forecast 2021-2026 ($ million)
- Exhibit 38: Chart on Power industry – Year-over-year growth 2021-2026 (%)
- Exhibit 39: Data Table on Power industry – Year-over-year growth 2021-2026 (%)
- 5.6 Coating industry – Market size and forecast 2021-2026
- Exhibit 40: Chart on Coating industry – Market size and forecast 2021-2026 ($ million)
- Exhibit 41: Data Table on Coating industry – Market size and forecast 2021-2026 ($ million)
- Exhibit 42: Chart on Coating industry – Year-over-year growth 2021-2026 (%)
- Exhibit 43: Data Table on Coating industry – Year-over-year growth 2021-2026 (%)
- 5.7 Others – Market size and forecast 2021-2026
- Exhibit 44: Chart on Others – Market size and forecast 2021-2026 ($ million)
- Exhibit 45: Data Table on Others – Market size and forecast 2021-2026 ($ million)
- Exhibit 46: Chart on Others – Year-over-year growth 2021-2026 (%)
- Exhibit 47: Data Table on Others – Year-over-year growth 2021-2026 (%)
- 5.8 Market opportunity by End-user
- Exhibit 48: Market opportunity by End-user ($ million)
6 Customer Landscape
- 6.1 Customer landscape overview
- Exhibit 49: Analysis of price sensitivity, lifecycle, customer purchase basket, adoption rates, and purchase criteria
7 Geographic Landscape
- 7.1 Geographic segmentation
- Exhibit 50: Chart on Market share by geography 2021-2026 (%)
- Exhibit 51: Data Table on Market share by geography 2021-2026 (%)
- 7.2 Geographic comparison
- Exhibit 52: Chart on Geographic comparison
- Exhibit 53: Data Table on Geographic comparison
- 7.3 APAC – Market size and forecast 2021-2026
- Exhibit 54: Chart on APAC – Market size and forecast 2021-2026 ($ million)
- Exhibit 55: Data Table on APAC – Market size and forecast 2021-2026 ($ million)
- Exhibit 56: Chart on APAC – Year-over-year growth 2021-2026 (%)
- Exhibit 57: Data Table on APAC – Year-over-year growth 2021-2026 (%)
- 7.4 North America – Market size and forecast 2021-2026
- Exhibit 58: Chart on North America – Market size and forecast 2021-2026 ($ million)
- Exhibit 59: Data Table on North America – Market size and forecast 2021-2026 ($ million)
- Exhibit 60: Chart on North America – Year-over-year growth 2021-2026 (%)
- Exhibit 61: Data Table on North America – Year-over-year growth 2021-2026 (%)
- 7.5 Europe – Market size and forecast 2021-2026
- Exhibit 62: Chart on Europe – Market size and forecast 2021-2026 ($ million)
- Exhibit 63: Data Table on Europe – Market size and forecast 2021-2026 ($ million)
- Exhibit 64: Chart on Europe – Year-over-year growth 2021-2026 (%)
- Exhibit 65: Data Table on Europe – Year-over-year growth 2021-2026 (%)
- 7.6 South America – Market size and forecast 2021-2026
- Exhibit 66: Chart on South America – Market size and forecast 2021-2026 ($ million)
- Exhibit 67: Data Table on South America – Market size and forecast 2021-2026 ($ million)
- Exhibit 68: Chart on South America – Year-over-year growth 2021-2026 (%)
- Exhibit 69: Data Table on South America – Year-over-year growth 2021-2026 (%)
- 7.7 Middle East and Africa – Market size and forecast 2021-2026
- Exhibit 70: Chart on Middle East and Africa – Market size and forecast 2021-2026 ($ million)
- Exhibit 71: Data Table on Middle East and Africa – Market size and forecast 2021-2026 ($ million)
- Exhibit 72: Chart on Middle East and Africa – Year-over-year growth 2021-2026 (%)
- Exhibit 73: Data Table on Middle East and Africa – Year-over-year growth 2021-2026 (%)
- 7.8 China – Market size and forecast 2021-2026
- Exhibit 74: Chart on China – Market size and forecast 2021-2026 ($ million)
- Exhibit 75: Data Table on China – Market size and forecast 2021-2026 ($ million)
- Exhibit 76: Chart on China – Year-over-year growth 2021-2026 (%)
- Exhibit 77: Data Table on China – Year-over-year growth 2021-2026 (%)
- 7.9 US – Market size and forecast 2021-2026
- Exhibit 78: Chart on US – Market size and forecast 2021-2026 ($ million)
- Exhibit 79: Data Table on US – Market size and forecast 2021-2026 ($ million)
- Exhibit 80: Chart on US – Year-over-year growth 2021-2026 (%)
- Exhibit 81: Data Table on US – Year-over-year growth 2021-2026 (%)
- 7.10 Japan – Market size and forecast 2021-2026
- Exhibit 82: Chart on Japan – Market size and forecast 2021-2026 ($ million)
- Exhibit 83: Data Table on Japan – Market size and forecast 2021-2026 ($ million)
- Exhibit 84: Chart on Japan – Year-over-year growth 2021-2026 (%)
- Exhibit 85: Data Table on Japan – Year-over-year growth 2021-2026 (%)
- 7.11 Germany – Market size and forecast 2021-2026
- Exhibit 86: Chart on Germany – Market size and forecast 2021-2026 ($ million)
- Exhibit 87: Data Table on Germany – Market size and forecast 2021-2026 ($ million)
- Exhibit 88: Chart on Germany – Year-over-year growth 2021-2026 (%)
- Exhibit 89: Data Table on Germany – Year-over-year growth 2021-2026 (%)
- 7.12 South Korea – Market size and forecast 2021-2026
- Exhibit 90: Chart on South Korea – Market size and forecast 2021-2026 ($ million)
- Exhibit 91: Data Table on South Korea – Market size and forecast 2021-2026 ($ million)
- Exhibit 92: Chart on South Korea – Year-over-year growth 2021-2026 (%)
- Exhibit 93: Data Table on South Korea – Year-over-year growth 2021-2026 (%)
- 7.13 Market opportunity by geography
- Exhibit 94: Market opportunity by geography ($ million)
8 Drivers, Challenges, and Trends
- 8.1 Market drivers
- 8.2 Market challenges
- 8.3 Impact of drivers and challenges
- Exhibit 95: Impact of drivers and challenges in 2021 and 2026
- 8.4 Market trends
9 Vendor Landscape
- 9.1 Overview
- 9.2 Vendor landscape
- Exhibit 96: Overview on Criticality of inputs and Factors of differentiation
- 9.3 Landscape disruption
- Exhibit 97: Overview on factors of disruption
- 9.4 Industry risks
- Exhibit 98: Impact of key risks on business
10 Vendor Analysis
- 10.1 Vendors covered
- Exhibit 99: Vendors covered
- 10.2 Market positioning of vendors
- Exhibit 100: Matrix on vendor position and classification
- 10.3 Atlas Copco AB
- Exhibit 101: Atlas Copco AB – Overview
- Exhibit 102: Atlas Copco AB – Business segments
- Exhibit 103: Atlas Copco AB – Key news
- Exhibit 104: Atlas Copco AB – Key offerings
- Exhibit 105: Atlas Copco AB – Segment focus
- 10.4 Becker Pumps Corp.
- Exhibit 106: Becker Pumps Corp. – Overview
- Exhibit 107: Becker Pumps Corp. – Product / Service
- Exhibit 108: Becker Pumps Corp. – Key offerings
- 10.5 Dekker Vacuum Technologies Inc.
- Exhibit 109: Dekker Vacuum Technologies Inc. – Overview
- Exhibit 110: Dekker Vacuum Technologies Inc. – Product / Service
- Exhibit 111: Dekker Vacuum Technologies Inc. – Key offerings
- 10.6 Graham Corp.
- Exhibit 112: Graham Corp. – Overview
- Exhibit 113: Graham Corp. – Product / Service
- Exhibit 114: Graham Corp. – Key offerings
- 10.7 IDEX Corp.
- Exhibit 115: IDEX Corp. – Overview
- Exhibit 116: IDEX Corp. – Business segments
- Exhibit 117: IDEX Corp. – Key offerings
- Exhibit 118: IDEX Corp. – Segment focus
- 10.8 Ingersoll Rand Inc.
- Exhibit 119: Ingersoll Rand Inc. – Overview
- Exhibit 120: Ingersoll Rand Inc. – Business segments
- Exhibit 121: Ingersoll Rand Inc. – Key offerings
- Exhibit 122: Ingersoll Rand Inc. – Segment focus
- 10.9 OC Oerlikon Corp. AG
- Exhibit 123: OC Oerlikon Corp. AG – Overview
- Exhibit 124: OC Oerlikon Corp. AG – Business segments
- Exhibit 125: OC Oerlikon Corp. AG – Key offerings
- Exhibit 126: OC Oerlikon Corp. AG – Segment focus
- 10.10 Pfeiffer Vacuum Technology AG
- Exhibit 127: Pfeiffer Vacuum Technology AG – Overview
- Exhibit 128: Pfeiffer Vacuum Technology AG – Business segments
- Exhibit 129: Pfeiffer Vacuum Technology AG – Key offerings
- Exhibit 130: Pfeiffer Vacuum Technology AG – Segment focus
- 10.11 Tuthill Corp.
- Exhibit 131: Tuthill Corp. – Overview
- Exhibit 132: Tuthill Corp. – Product / Service
- Exhibit 133: Tuthill Corp. – Key offerings
- 10.12 ULVAC Inc.
- Exhibit 134: ULVAC Inc. – Overview
- Exhibit 135: ULVAC Inc. – Business segments
- Exhibit 136: ULVAC Inc. – Key news
- Exhibit 137: ULVAC Inc. – Key offerings
- Exhibit 138: ULVAC Inc. – Segment focus
11 Appendix
- 11.1 Scope of the report
- 11.2 Inclusions and exclusions checklist
- Exhibit 139: Inclusions checklist
- Exhibit 140: Exclusions checklist
- 11.3 Currency conversion rates for US$
- Exhibit 141: Currency conversion rates for US$
- 11.4 Research methodology
- Exhibit 142: Research methodology
- Exhibit 143: Validation techniques employed for market sizing
- Exhibit 144: Information sources
- 11.5 List of abbreviations
- Exhibit 145: List of abbreviations
Technavio is a leading global technology research and advisory company. Their research and analysis focus on emerging market trends and provide actionable insights to help businesses identify market opportunities and develop effective strategies to optimize their market positions. With over 500 specialized analysts, Technavio’s report library consists of more than 17,000 reports and counting, covering 800 technologies, spanning across 50 countries. Their client base consists of enterprises of all sizes, including more than 100 Fortune 500 companies. This growing client base relies on Technavio’s comprehensive coverage, extensive research, and actionable market insights to identify opportunities in existing and potential markets and assess their competitive positions within changing market scenarios.
Contact
Technavio Research
Jesse Maida
Media & Marketing Executive
US: +1 844 364 1100
UK: +44 203 893 3200
Email: media@technavio.com
Website: www.technavio.com/
![]()
![]() View original content to download multimedia:https://www.prnewswire.com/news-releases/industrial-vacuum-pump-market-size-to-grow-by-usd-1-16-billion–rise-in-the-electrification-of-mechanical-components-to-be-a-key-trend–technavio-301560143.html
View original content to download multimedia:https://www.prnewswire.com/news-releases/industrial-vacuum-pump-market-size-to-grow-by-usd-1-16-billion–rise-in-the-electrification-of-mechanical-components-to-be-a-key-trend–technavio-301560143.html
SOURCE Technavio

Source link
The content is by PR Newswire. Headlines of Today Media is not responsible for the content provided or any links related to this content. Headlines of Today Media is not responsible for the correctness, topicality or the quality of the content.