[ad_2]
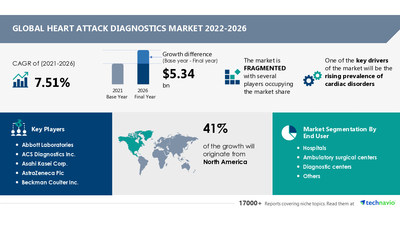
NEW YORK, Sept. 12, 2022 /PRNewswire/ — The heart attack diagnostics market growth is driven by factors such as the rising prevalence of cardiac disorders. The prevalence of cardiac disorders such as sick sinus syndrome, bradycardia, atrioventricular blocks, valvular diseases, ventricular fibrillation, and tachycardia has increased across the world over the past few years. This has resulted in an increase in the occurrence of cardiac arrests worldwide. Moreover, the rising geriatric population, the increase in cases of congenital heart defects, and other heart-related disorders are some of the factors behind the adoption of cardiac diagnostics for heart attacks, which will result in the growth of the global heart attack diagnostics market during the forecast period.

The heart attack diagnostics market size is expected to grow by USD 5.34 bn from 2021 to 2026. In addition, the growth momentum of the market will accelerate at a CAGR of 7.51% during the forecast period.
Make confident decisions using the insights and analysis by Technavio. Request a FREE PDF Sample Report
New product launches, coupled with R&D activities, are one of the major trends in the market. Vendors are focusing on the development and fast approvals of new heart attack diagnostic devices. New product development, coupled with R&D activities, helps vendors to sustain their position in the market. Vendors are launching innovative devices for enhancing the clinical outcomes of heart attack diagnostic devices, such as electrocardiogram (ECG) machines and Troponin for greater visualization. In addition, vendors are engaged in R&D activities and are planning to launch innovative products in the coming years. They are concentrating on developing technologically advanced 3D mammography equipment.
Technavio offers key trends that will impact the future of the heart attack diagnostics market. View our FREE PDF Sample Report
This market research report segments the heart attack diagnostics market by end-user (hospitals, ambulatory surgical centers, diagnostic centers, and others) and geography (North America, Europe, Asia, and Rest of World (ROW)).
North America will lead the heart attack diagnostics market during the forecast period. Its growth is driven by factors such as the high prevalence of heart disorders such as congenital heart diseases (CHDs), heart valve diseases, stenosis, and atresia in the region. However, market growth in this region will be slower than the growth of the market in other regions. The US and Canada are the key countries for the heart attack diagnostics market in North America.
The hospital segment will be the largest revenue-generating end-user segment during the forecast period. The growth of this region is attributed to factors such as the increasing prevalence of hypertension, high blood cholesterol, and smoking. In addition, the growing number of cardiac cases such as stroke and heart attacks has increased the need for the detection of troponin, creatine kinase, and C-Reactive Protein. This has led to a surge in the establishment of hospitals concerning the heart attack diagnostics market during the forecast period.
This report provides a full list of key vendors, their strategies, and the latest developments. Request a FREE PDF Sample Now
Related Reports
Prosthetic Heart Valves Market by Product and Geography – Forecast and Analysis 2022-2026
Bioinformatics Market by Product and Geography – Forecast and Analysis 2022-2026
|
Heart Attack Diagnostics Market Scope |
|
|
Report Coverage |
Details |
|
Page number |
120 |
|
Base year |
2021 |
|
Forecast period |
2022-2026 |
|
Growth momentum & CAGR |
Accelerate at a CAGR of 7.51% |
|
Market growth 2022-2026 |
USD 5.34 billion |
|
Market structure |
Fragmented |
|
YoY growth (%) |
7.0 |
|
Regional analysis |
North America, Europe, Asia, and Rest of World (ROW) |
|
Performing market contribution |
North America at 41% |
|
Key consumer countries |
US, Canada, Germany, UK, and China |
|
Competitive landscape |
Leading companies, Competitive strategies, Consumer engagement scope |
|
Key companies profiled |
Abbott Laboratories, ACS Diagnostics Inc., Asahi Kasei Corp., AstraZeneca Plc, Beckman Coulter Inc., Bio Rad Laboratories Inc., Bionet Co. Ltd., Boston Scientific Corp., Canon Inc., F. Hoffmann La Roche Ltd., FUJIFILM Holdings Corp., General Electric Co., HILL ROM HOLDINGS Inc., Hitachi Ltd., Koninklijke Philips NV, Midmark Corp., Nihon Kohden Corp, SCHILLER AG, Siemens AG, and Toshiba Corp. |
|
Market dynamics |
Parent market analysis, market growth inducers and obstacles, fast-growing and slow-growing segment analysis, COVI-19 impact and recovery analysis and future consumer dynamics, and Market condition analysis for the forecast period. |
|
Customization purview |
If our report has not included the data that you are looking for, you can reach out to our analysts and get segments customized. |
Browse Health Care Market Reports
Table of Contents
1 Executive Summary
- 1.1 Market overview
- Exhibit 01: Executive Summary – Chart on Market Overview
- Exhibit 02: Executive Summary – Data Table on Market Overview
- Exhibit 03: Executive Summary – Chart on Global Market Characteristics
- Exhibit 04: Executive Summary – Chart on Market by Geography
- Exhibit 05: Executive Summary – Chart on Market Segmentation by End-user
- Exhibit 06: Executive Summary – Chart on Incremental Growth
- Exhibit 07: Executive Summary – Data Table on Incremental Growth
- Exhibit 08: Executive Summary – Chart on Vendor Market Positioning
2 Market Landscape
- 2.1 Market ecosystem
- Exhibit 09: Parent market
- Exhibit 10: Market Characteristics
3 Market Sizing
- 3.1 Market definition
- Exhibit 11: Offerings of vendors included in the market definition
- 3.2 Market segment analysis
- Exhibit 12: Market segments
- 3.3 Market size 2021
- 3.4 Market outlook: Forecast for 2021-2026
- Exhibit 13: Chart on Global – Market size and forecast 2021-2026 ($ million)
- Exhibit 14: Data Table on Global – Market size and forecast 2021-2026 ($ million)
- Exhibit 15: Chart on Global Market: Year-over-year growth 2021-2026 (%)
- Exhibit 16: Data Table on Global Market: Year-over-year growth 2021-2026 (%)
4 Five Forces Analysis
- 4.1 Five forces summary
- Exhibit 17: Five forces analysis – Comparison between 2021 and 2026
- 4.2 Bargaining power of buyers
- Exhibit 18: Chart on Bargaining power of buyers – Impact of key factors 2021 and 2026
- 4.3 Bargaining power of suppliers
- Exhibit 19: Bargaining power of suppliers – Impact of key factors in 2021 and 2026
- 4.4 Threat of new entrants
- Exhibit 20: Threat of new entrants – Impact of key factors in 2021 and 2026
- 4.5 Threat of substitutes
- Exhibit 21: Threat of substitutes – Impact of key factors in 2021 and 2026
- 4.6 Threat of rivalry
- Exhibit 22: Threat of rivalry – Impact of key factors in 2021 and 2026
- 4.7 Market condition
- Exhibit 23: Chart on Market condition – Five forces 2021 and 2026
5 Market Segmentation by End-user
- 5.1 Market segments
- Exhibit 24: Chart on End-user – Market share 2021-2026 (%)
- Exhibit 25: Data Table on End-user – Market share 2021-2026 (%)
- 5.2 Comparison by End-user
- Exhibit 26: Chart on Comparison by End-user
- Exhibit 27: Data Table on Comparison by End-user
- 5.3 Hospitals – Market size and forecast 2021-2026
- Exhibit 28: Chart on Hospitals – Market size and forecast 2021-2026 ($ million)
- Exhibit 29: Data Table on Hospitals – Market size and forecast 2021-2026 ($ million)
- Exhibit 30: Chart on Hospitals – Year-over-year growth 2021-2026 (%)
- Exhibit 31: Data Table on Hospitals – Year-over-year growth 2021-2026 (%)
- 5.4 Ambulatory surgical centers – Market size and forecast 2021-2026
- Exhibit 32: Chart on Ambulatory surgical centers – Market size and forecast 2021-2026 ($ million)
- Exhibit 33: Data Table on Ambulatory surgical centers – Market size and forecast 2021-2026 ($ million)
- Exhibit 34: Chart on Ambulatory surgical centers – Year-over-year growth 2021-2026 (%)
- Exhibit 35: Data Table on Ambulatory surgical centers – Year-over-year growth 2021-2026 (%)
- 5.5 Diagnostic centers – Market size and forecast 2021-2026
- Exhibit 36: Chart on Diagnostic centers – Market size and forecast 2021-2026 ($ million)
- Exhibit 37: Data Table on Diagnostic centers – Market size and forecast 2021-2026 ($ million)
- Exhibit 38: Chart on Diagnostic centers – Year-over-year growth 2021-2026 (%)
- Exhibit 39: Data Table on Diagnostic centers – Year-over-year growth 2021-2026 (%)
- 5.6 Others – Market size and forecast 2021-2026
- Exhibit 40: Chart on Others – Market size and forecast 2021-2026 ($ million)
- Exhibit 41: Data Table on Others – Market size and forecast 2021-2026 ($ million)
- Exhibit 42: Chart on Others – Year-over-year growth 2021-2026 (%)
- Exhibit 43: Data Table on Others – Year-over-year growth 2021-2026 (%)
- 5.7 Market opportunity by End-user
- Exhibit 44: Market opportunity by End-user ($ million)
6 Customer Landscape
- 6.1 Customer landscape overview
- Exhibit 45: Analysis of price sensitivity, lifecycle, customer purchase basket, adoption rates, and purchase criteria
7 Geographic Landscape
- 7.1 Geographic segmentation
- Exhibit 46: Chart on Market share by geography 2021-2026 (%)
- Exhibit 47: Data Table on Market share by geography 2021-2026 (%)
- 7.2 Geographic comparison
- Exhibit 48: Chart on Geographic comparison
- Exhibit 49: Data Table on Geographic comparison
- 7.3 North America – Market size and forecast 2021-2026
- Exhibit 50: Chart on North America – Market size and forecast 2021-2026 ($ million)
- Exhibit 51: Data Table on North America – Market size and forecast 2021-2026 ($ million)
- Exhibit 52: Chart on North America – Year-over-year growth 2021-2026 (%)
- Exhibit 53: Data Table on North America – Year-over-year growth 2021-2026 (%)
- 7.4 Europe – Market size and forecast 2021-2026
- Exhibit 54: Chart on Europe – Market size and forecast 2021-2026 ($ million)
- Exhibit 55: Data Table on Europe – Market size and forecast 2021-2026 ($ million)
- Exhibit 56: Chart on Europe – Year-over-year growth 2021-2026 (%)
- Exhibit 57: Data Table on Europe – Year-over-year growth 2021-2026 (%)
- 7.5 Asia – Market size and forecast 2021-2026
- Exhibit 58: Chart on Asia – Market size and forecast 2021-2026 ($ million)
- Exhibit 59: Data Table on Asia – Market size and forecast 2021-2026 ($ million)
- Exhibit 60: Chart on Asia – Year-over-year growth 2021-2026 (%)
- Exhibit 61: Data Table on Asia – Year-over-year growth 2021-2026 (%)
- 7.6 Rest of World (ROW) – Market size and forecast 2021-2026
- Exhibit 62: Chart on Rest of World (ROW) – Market size and forecast 2021-2026 ($ million)
- Exhibit 63: Data Table on Rest of World (ROW) – Market size and forecast 2021-2026 ($ million)
- Exhibit 64: Chart on Rest of World (ROW) – Year-over-year growth 2021-2026 (%)
- Exhibit 65: Data Table on Rest of World (ROW) – Year-over-year growth 2021-2026 (%)
- 7.7 US – Market size and forecast 2021-2026
- Exhibit 66: Chart on US – Market size and forecast 2021-2026 ($ million)
- Exhibit 67: Data Table on US – Market size and forecast 2021-2026 ($ million)
- Exhibit 68: Chart on US – Year-over-year growth 2021-2026 (%)
- Exhibit 69: Data Table on US – Year-over-year growth 2021-2026 (%)
- 7.8 Germany – Market size and forecast 2021-2026
- Exhibit 70: Chart on Germany – Market size and forecast 2021-2026 ($ million)
- Exhibit 71: Data Table on Germany – Market size and forecast 2021-2026 ($ million)
- Exhibit 72: Chart on Germany – Year-over-year growth 2021-2026 (%)
- Exhibit 73: Data Table on Germany – Year-over-year growth 2021-2026 (%)
- 7.9 UK – Market size and forecast 2021-2026
- Exhibit 74: Chart on UK – Market size and forecast 2021-2026 ($ million)
- Exhibit 75: Data Table on UK – Market size and forecast 2021-2026 ($ million)
- Exhibit 76: Chart on UK – Year-over-year growth 2021-2026 (%)
- Exhibit 77: Data Table on UK – Year-over-year growth 2021-2026 (%)
- 7.10 Canada – Market size and forecast 2021-2026
- Exhibit 78: Chart on Canada – Market size and forecast 2021-2026 ($ million)
- Exhibit 79: Data Table on Canada – Market size and forecast 2021-2026 ($ million)
- Exhibit 80: Chart on Canada – Year-over-year growth 2021-2026 (%)
- Exhibit 81: Data Table on Canada – Year-over-year growth 2021-2026 (%)
- 7.11 China – Market size and forecast 2021-2026
- Exhibit 82: Chart on China – Market size and forecast 2021-2026 ($ million)
- Exhibit 83: Data Table on China – Market size and forecast 2021-2026 ($ million)
- Exhibit 84: Chart on China – Year-over-year growth 2021-2026 (%)
- Exhibit 85: Data Table on China – Year-over-year growth 2021-2026 (%)
- 7.12 Market opportunity by geography
- Exhibit 86: Market opportunity by geography ($ million)
8 Drivers, Challenges, and Trends
- 8.1 Market drivers
- 8.2 Market challenges
- 8.3 Impact of drivers and challenges
- Exhibit 87: Impact of drivers and challenges in 2021 and 2026
- 8.4 Market trends
9 Vendor Landscape
- 9.1 Overview
- 9.2 Vendor landscape
- Exhibit 88: Overview on Criticality of inputs and Factors of differentiation
- 9.3 Landscape disruption
- Exhibit 89: Overview on factors of disruption
- 9.4 Industry risks
- Exhibit 90: Impact of key risks on business
10 Vendor Analysis
- 10.1 Vendors covered
- Exhibit 91: Vendors covered
- 10.2 Market positioning of vendors
- Exhibit 92: Matrix on vendor position and classification
- 10.3 Abbott Laboratories
- Exhibit 93: Abbott Laboratories – Overview
- Exhibit 94: Abbott Laboratories – Business segments
- Exhibit 95: Abbott Laboratories – Key news
- Exhibit 96: Abbott Laboratories – Key offerings
- Exhibit 97: Abbott Laboratories – Segment focus
- 10.4 F. Hoffmann La Roche Ltd.
- Exhibit 98: F. Hoffmann La Roche Ltd. – Overview
- Exhibit 99: F. Hoffmann La Roche Ltd. – Business segments
- Exhibit 100: F. Hoffmann La Roche Ltd. – Key news
- Exhibit 101: F. Hoffmann La Roche Ltd. – Key offerings
- Exhibit 102: F. Hoffmann La Roche Ltd. – Segment focus
- 10.5 General Electric Co.
- Exhibit 103: General Electric Co. – Overview
- Exhibit 104: General Electric Co. – Business segments
- Exhibit 105: General Electric Co. – Key news
- Exhibit 106: General Electric Co. – Key offerings
- Exhibit 107: General Electric Co. – Segment focus
- 10.6 HILL ROM HOLDINGS Inc.
- Exhibit 108: HILL ROM HOLDINGS Inc. – Overview
- Exhibit 109: HILL ROM HOLDINGS Inc. – Business segments
- Exhibit 110: HILL ROM HOLDINGS Inc. – Key news
- Exhibit 111: HILL ROM HOLDINGS Inc. – Key offerings
- Exhibit 112: HILL ROM HOLDINGS Inc. – Segment focus
- 10.7 Hitachi Ltd.
- Exhibit 113: Hitachi Ltd. – Overview
- Exhibit 114: Hitachi Ltd. – Business segments
- Exhibit 115: Hitachi Ltd. – Key news
- Exhibit 116: Hitachi Ltd. – Key offerings
- Exhibit 117: Hitachi Ltd. – Segment focus
- 10.8 Koninklijke Philips NV
- Exhibit 118: Koninklijke Philips NV – Overview
- Exhibit 119: Koninklijke Philips NV – Business segments
- Exhibit 120: Koninklijke Philips NV – Key news
- Exhibit 121: Koninklijke Philips NV – Key offerings
- Exhibit 122: Koninklijke Philips NV – Segment focus
- 10.9 Midmark Corp.
- Exhibit 123: Midmark Corp. – Overview
- Exhibit 124: Midmark Corp. – Product / Service
- Exhibit 125: Midmark Corp. – Key offerings
- 10.10 SCHILLER AG
- Exhibit 126: SCHILLER AG – Overview
- Exhibit 127: SCHILLER AG – Product / Service
- Exhibit 128: SCHILLER AG – Key offerings
- 10.11 Siemens AG
- Exhibit 129: Siemens AG – Overview
- Exhibit 130: Siemens AG – Business segments
- Exhibit 131: Siemens AG – Key news
- Exhibit 132: Siemens AG – Key offerings
- Exhibit 133: Siemens AG – Segment focus
- 10.12 Toshiba Corp.
- Exhibit 134: Toshiba Corp. – Overview
- Exhibit 135: Toshiba Corp. – Business segments
- Exhibit 136: Toshiba Corp. – Key news
- Exhibit 137: Toshiba Corp. – Key offerings
- Exhibit 138: Toshiba Corp. – Segment focus
11 Appendix
- 11.1 Scope of the report
- 11.2 Inclusions and exclusions checklist
- Exhibit 139: Inclusions checklist
- Exhibit 140: Exclusions checklist
- 11.3 Currency conversion rates for US$
- Exhibit 141: Currency conversion rates for US$
- 11.4 Research methodology
- Exhibit 142: Research methodology
- Exhibit 143: Validation techniques employed for market sizing
- Exhibit 144: Information sources
- 11.5 List of abbreviations
- Exhibit 145: List of abbreviations
Technavio is a leading global technology research and advisory company. Their research and analysis focus on emerging market trends and provide actionable insights to help businesses identify market opportunities and develop effective strategies to optimize their market positions.
With over 500 specialized analysts, Technavio’s report library consists of more than 17,000 reports and counting, covering 800 technologies, spanning across 50 countries. Their client base consists of enterprises of all sizes, including more than 100 Fortune 500 companies. This growing client base relies on Technavio’s comprehensive coverage, extensive research, and actionable market insights to identify opportunities in existing and potential markets and assess their competitive positions within changing market scenarios.
Contacts
Technavio Research
Jesse Maida
Media & Marketing Executive
US: +1 844 364 1100
UK: +44 203 893 3200
Email: media@technavio.com
Website: www.technavio.com/
![]()
![]() View original content to download multimedia:https://www.prnewswire.com/news-releases/heart-attack-diagnostics-market-size-to-grow-by-usd-5-34-billion-rising-prevalence-of-cardiac-disorders-to-drive-growth—technavio-301621756.html
View original content to download multimedia:https://www.prnewswire.com/news-releases/heart-attack-diagnostics-market-size-to-grow-by-usd-5-34-billion-rising-prevalence-of-cardiac-disorders-to-drive-growth—technavio-301621756.html
SOURCE Technavio

Source link
[ad_2]
The content is by PR Newswire. Headlines of Today Media is not responsible for the content provided or any links related to this content. Headlines of Today Media is not responsible for the correctness, topicality or the quality of the content.
[ad_2]