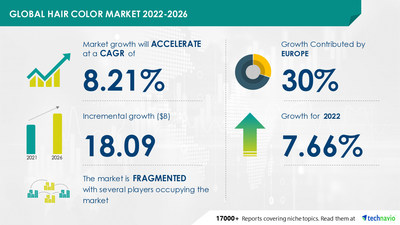
NEW YORK , Aug. 8, 2022 /PRNewswire/ — The Global Hair Color Market offers a comprehensive analysis of new product launches, the latest trends, and the post-pandemic impact on businesses. The global hair color market value is anticipated to grow by USD 18.09 billion, progressing at a CAGR of 8.21% as per the latest market forecast report by Technavio. 30% of the market’s growth will originate from Europe during the forecast period. The UK is the key market for hair color in Europe. Market growth in this region will be slower than the growth of the market in other regions. The intense competition among vendors, leading to the expansion of distribution networks and the adoption of multichannel marketing strategies, especially in Western European countries will facilitate the hair color market growth in Europe over the forecast period.

To know more about the regional segments – Request a FREE Sample Now!
- Major Driver– The key factor driving growth in the global hair color market is the innovation in product formulation and formats. Hair color is available in pre-measured sachets that are convenient to use. The market is driven by innovations in product formulation, composition, and the format through which it is sold in the market. The formulation of hair color is done in two stages. The first stage deals with the development of the product base and the second stage involved the formulation of the desired shade. During the process of the formulation, special attention needs to be given to factors such as dye stability, color wearability on hair, light fading, and the rheology of the product. The innovation is brought about in the shades of the finished product. Presently, most hair color manufacturers produce hair colors that help brighten the hair, contributing to the popularity of the product among consumers. This is followed by hair color variants that claim to be long-lasting, easy to use, and herbal. These innovations have led to an increase in customer acquisition, product visibility, and adoption rate, driving the price quotient of the market.
- Major Challenges – The limited consumer pool for novelty and premium hair colors in developing countries will be a major challenge for the global hair color market during the forecast period. The global hair color market is flourishing in the developed markets of North America and Europe. This is because a significant proportion of premium and mass segments of end customers are available in this segment. Hence, these markets have a balanced demand for hair colors from different price brackets. Unlike countries in North America and Europe, APAC and MEA do not have an equal distribution of consumer segments. The proportion of mass segment customers in these regions is higher than that of the end-end customers. This results in significant sales of low-priced hair colors in the markets of these regions. However, the sale of premium hair colors and novelty hair colors in APAC and MEA is low due to the low presence of the segment. The low sale of premium hair colors leads to a small revenue turnover. Thus, the value of revenue generated from these regions is low.
To know more about the market dynamics along with the latest trends – Click Now!
The global hair color market is fragmented and the vendors are deploying growth strategies such as focusing on product innovations by bringing about the concept of product differentiation and new product developments to compete in the market. The hair color market report provides complete insights on key vendors including Amway Corp., Avon, Cadiveu Professional, Chatters Ltd. Partnership, Coty Inc., The Estee Lauder Co. Inc., Godrej and Boyce Manufacturing Co. Ltd., Henkel AG and Co. KGaA, Hoyu Co. Ltd., John Paul Mitchell Systems, Kao Corp., LOreal SA, Madison Reed Inc., Moroccanoil Inc., NATULIQUE Ltd., NATURIGIN, Revlon Inc., Shiseido Co.Ltd., Surya Brasil, Tints of Nature, Tish and Snookys NYC Inc., and Unilever PLC.
- Amway Corp. – The company offers color CREATION permanent hair color which has been formulated with natural extracts and conditioners to create a unique blend of ingredients for protecting the scalp and hair.
- To know about all vendor offerings – Grab a FREE Sample Now!
- By Product, the market is classified into Permanent, Semi-permanent, Temporary, and Highlights and bleach
- By End Users, the market is classified into Women, Men, and Unisex
- By Geography, the market is classified as Europe, North America, APAC, South America, the Middle East, and Africa.
To know about the market contribution of each segment – Request an Exclusive FREE Sample Now!
The competitive scenario provided in the Global Hair Color Market report analyzes, evaluates, and positions companies based on various performance indicators. Some of the factors considered for this analysis include the financial performance of companies over the past few years, growth strategies, product innovations, new product launches, investments, growth in market share, etc.Don’t wait, Make a strategic approach & boost your business goals with our Global Hair Color Market Forecast Report – Buy Now!
- The dry shampoo market share is expected to increase to USD 1.42 billion in 2026 from 2021, at a CAGR of 10.49%.
- The haircare market share in Africa is expected to increase to USD 994.06 million from 2021 to 2026, and the market’s growth momentum will accelerate at a CAGR of 6.35%.
|
Global Hair Color Market Scope |
|
|
Report Coverage |
Details |
|
Page number |
120 |
|
Base year |
2021 |
|
Forecast period |
2022-2026 |
|
Growth momentum & CAGR |
Accelerate at a CAGR of 8.21% |
|
Market growth 2022-2026 |
USD 18.09 billion |
|
Market structure |
Fragmented |
|
YoY growth (%) |
7.66 |
|
Regional analysis |
Europe, North America, APAC, South America, the Middle East, and Africa |
|
Performing market contribution |
Europe at 30% |
|
Key consumer countries |
US, Japan, China, UK, and Brazil |
|
Competitive landscape |
Leading companies, competitive strategies, consumer engagement scope |
|
Companies profiled |
Amway Corp., Avon, Cadiveu Professional, Chatters Ltd. Partnership, Coty Inc., The Estee Lauder Co. Inc., Godrej and Boyce Manufacturing Co. Ltd., Henkel AG and Co. KGaA, Hoyu Co. Ltd., John Paul Mitchell Systems, Kao Corp., LOreal SA, Madison Reed Inc., Moroccanoil Inc., NATULIQUE Ltd., NATURIGIN, Revlon Inc., Shiseido Co.Ltd., Surya Brasil, Tints of Nature, Tish and Snookys NYC Inc., and Unilever PLC |
|
Market Dynamics |
Parent market analysis, Market growth inducers and obstacles, Fast-growing and slow-growing segment analysis, COVID 19 impact and future consumer dynamics, market condition analysis for forecast period, |
|
Customization purview |
If our report has not included the data that you are looking for, you can reach out to our analysts and get segments customized. |
Browse for Technavio “Consumer Staples Market” Research Reports
1 Executive Summary
- 1.1 Market Overview
- Exhibit 01: Executive Summary – Chart on Market Overview
- Exhibit 02: Executive Summary – Data Table on Market Overview
- Exhibit 03: Executive Summary – Chart on Global Market Characteristics
- Exhibit 04: Executive Summary – Chart on Market by Geography
- Exhibit 05: Executive Summary – Chart on Market Segmentation by Product
- Exhibit 06: Executive Summary – Chart on Market Segmentation by End-user
- Exhibit 07: Executive Summary – Chart on Incremental Growth
- Exhibit 08: Executive Summary – Data Table on Incremental Growth
- Exhibit 09: Executive Summary – Chart on Vendor Market Positioning
2 Market Landscape
- 2.1 Market ecosystem
- Exhibit 10: Parent market
- Exhibit 11: Market Characteristics
3 Market Sizing
- 3.1 Market definition
- Exhibit 12: Offerings of vendors included in the market definition
- 3.2 Market segment analysis
- Exhibit 13: Market segments
- 3.3 Market size 2021
- 3.4 Market outlook: Forecast for 2021-2026
- Exhibit 14: Chart on Global – Market size and forecast 2021-2026 ($ million)
- Exhibit 15: Data Table on Global – Market size and forecast 2021-2026 ($ million)
- Exhibit 16: Chart on Global Market: Year-over-year growth 2021-2026 (%)
- Exhibit 17: Data Table on Global Market: Year-over-year growth 2021-2026 (%)
4 Five Forces Analysis
- 4.1 Five forces summary
- Exhibit 18: Five forces analysis – Comparison between 2021 and 2026
- 4.2 Bargaining power of buyers
- Exhibit 19: Chart on the Bargaining power of buyers – Impact of key factors 2021 and 2026
- 4.3 Bargaining power of suppliers
- Exhibit 20: Bargaining power of suppliers – Impact of key factors in 2021 and 2026
- 4.4 Threat of new entrants
- Exhibit 21: Threat of new entrants – Impact of key factors in 2021 and 2026
- 4.5 Threat of substitutes
- Exhibit 22: Threat of substitutes – Impact of key factors in 2021 and 2026
- 4.6 Threat of rivalry
- Exhibit 23: Threat of rivalry – Impact of key factors in 2021 and 2026
- 4.7 Market condition
- Exhibit 24: Chart on Market condition – Five forces 2021 and 2026
5 Market Segmentation by Product
- 5.1 Market segments
- Exhibit 25: Chart on Product – Market share 2021-2026 (%)
- Exhibit 26: Data Table on Product – Market share 2021-2026 (%)
- 5.2 Comparison by Product
- Exhibit 27: Chart on Comparison by Product
- Exhibit 28: Data Table on Comparison by Product
- 5.3 Permanent – Market size and forecast 2021-2026
- Exhibit 29: Chart on Permanent – Market size and forecast 2021-2026 ($ million)
- Exhibit 30: Data Table on Permanent – Market size and forecast 2021-2026 ($ million)
- Exhibit 31: Chart on Permanent – Year-over-year growth 2021-2026 (%)
- Exhibit 32: Data Table on Permanent – Year-over-year growth 2021-2026 (%)
- 5.4 Semi-permanent – Market size and forecast 2021-2026
- Exhibit 33: Chart on Semi-permanent – Market size and forecast 2021-2026 ($ million)
- Exhibit 34: Data Table on Semi-permanent – Market size and forecast 2021-2026 ($ million)
- Exhibit 35: Chart on Semi-permanent – Year-over-year growth 2021-2026 (%)
- Exhibit 36: Data Table on Semi-permanent – Year-over-year growth 2021-2026 (%)
- 5.5 Temporary – Market size and forecast 2021-2026
- Exhibit 37: Chart on Temporary – Market size and forecast 2021-2026 ($ million)
- Exhibit 38: Data Table on Temporary – Market size and forecast 2021-2026 ($ million)
- Exhibit 39: Chart on Temporary – Year-over-year growth 2021-2026 (%)
- Exhibit 40: Data Table on Temporary – Year-over-year growth 2021-2026 (%)
- 5.6 Highlights and bleach – Market size and forecast 2021-2026
- Exhibit 41: Chart on Highlights and bleach – Market size and forecast 2021-2026 ($ million)
- Exhibit 42: Data Table on Highlights and bleach – Market size and forecast 2021-2026 ($ million)
- Exhibit 43: Chart on Highlights and bleach – Year-over-year growth 2021-2026 (%)
- Exhibit 44: Data Table on Highlights and bleach – Year-over-year growth 2021-2026 (%)
- 5.7 Market opportunity by Product
- Exhibit 45: Market opportunity by Product ($ million)
6 Market Segmentation by End-user
- 6.1 Market segments
- Exhibit 46: Chart on End-user – Market share 2021-2026 (%)
- Exhibit 47: Data Table on End-user – Market share 2021-2026 (%)
- 6.2 Comparison by End-user
- Exhibit 48: Chart on Comparison by End-user
- Exhibit 49: Data Table on Comparison by End-user
- 6.3 Women – Market size and forecast 2021-2026
- Exhibit 50: Chart on Women – Market size and forecast 2021-2026 ($ million)
- Exhibit 51: Data Table on Women – Market size and forecast 2021-2026 ($ million)
- Exhibit 52: Chart on Women – Year-over-year growth 2021-2026 (%)
- Exhibit 53: Data Table on Women – Year-over-year growth 2021-2026 (%)
- 6.4 Men – Market size and forecast 2021-2026
- Exhibit 54: Chart on Men – Market size and forecast 2021-2026 ($ million)
- Exhibit 55: Data Table on Men – Market size and forecast 2021-2026 ($ million)
- Exhibit 56: Chart on Men – Year-over-year growth 2021-2026 (%)
- Exhibit 57: Data Table on Men – Year-over-year growth 2021-2026 (%)
- 6.5 Unisex – Market size and forecast 2021-2026
- Exhibit 58: Chart on Unisex – Market size and forecast 2021-2026 ($ million)
- Exhibit 59: Data Table on Unisex – Market size and forecast 2021-2026 ($ million)
- Exhibit 60: Chart on Unisex – Year-over-year growth 2021-2026 (%)
- Exhibit 61: Data Table on Unisex – Year-over-year growth 2021-2026 (%)
- 6.6 Market opportunity by End-user
- Exhibit 62: Market opportunity by End-user ($ million)
7 Customer Landscape
- 7.1 Customer landscape overview
- Exhibit 63: Analysis of price sensitivity, lifecycle, customer purchase basket, adoption rates, and purchase criteria
8 Geographic Landscape
- 8.1 Geographic segmentation
- Exhibit 64: Chart on Market share by geography 2021-2026 (%)
- Exhibit 65: Data Table on Market share by geography 2021-2026 (%)
- 8.2 Geographic comparison
- Exhibit 66: Chart on Geographic comparison
- Exhibit 67: Data Table on Geographic comparison
- 8.3 Europe – Market size and forecast 2021-2026
- Exhibit 68: Chart on Europe – Market size and forecast 2021-2026 ($ million)
- Exhibit 69: Data Table on Europe – Market size and forecast 2021-2026 ($ million)
- Exhibit 70: Chart on Europe – Year-over-year growth 2021-2026 (%)
- Exhibit 71: Data Table on Europe – Year-over-year growth 2021-2026 (%)
- 8.4 North America – Market size and forecast 2021-2026
- Exhibit 72: Chart on North America – Market size and forecast 2021-2026 ($ million)
- Exhibit 73: Data Table on North America – Market size and forecast 2021-2026 ($ million)
- Exhibit 74: Chart on North America – Year-over-year growth 2021-2026 (%)
- Exhibit 75: Data Table on North America – Year-over-year growth 2021-2026 (%)
- 8.5 APAC – Market size and forecast 2021-2026
- Exhibit 76: Chart on APAC – Market size and forecast 2021-2026 ($ million)
- Exhibit 77: Data Table on APAC – Market size and forecast 2021-2026 ($ million)
- Exhibit 78: Chart on APAC – Year-over-year growth 2021-2026 (%)
- Exhibit 79: Data Table on APAC – Year-over-year growth 2021-2026 (%)
- 8.6 South America – Market size and forecast 2021-2026
- Exhibit 80: Chart of South America – Market size and forecast 2021-2026 ($ million)
- Exhibit 81: Data Table on South America – Market size and forecast 2021-2026 ($ million)
- Exhibit 82: Chart on South America – Year-over-year growth 2021-2026 (%)
- Exhibit 83: Data Table on South America – Year-over-year growth 2021-2026 (%)
- 8.7 The Middle East and Africa – Market size and forecast 2021-2026
- Exhibit 84: Chart on the Middle East and Africa – Market size and forecast 2021-2026 ($ million)
- Exhibit 85: Data Table on the Middle East and Africa – Market size and forecast 2021-2026 ($ million)
- Exhibit 86: Chart on the Middle East and Africa – Year-over-year growth 2021-2026 (%)
- Exhibit 87: Data Table on the Middle East and Africa – Year-over-year growth 2021-2026 (%)
- 8.8 US – Market size and forecast 2021-2026
- Exhibit 88: Chart on the US – Market size and forecast 2021-2026 ($ million)
- Exhibit 89: Data Table on the US – Market size and forecast 2021-2026 ($ million)
- Exhibit 90: Chart on US – Year-over-year growth 2021-2026 (%)
- Exhibit 91: Data Table on the US – Year-over-year growth 2021-2026 (%)
- 8.9 Brazil – Market size and forecast 2021-2026
- Exhibit 92: Chart on Brazil – Market size and forecast 2021-2026 ($ million)
- Exhibit 93: Data Table on Brazil – Market size and forecast 2021-2026 ($ million)
- Exhibit 94: Chart on Brazil – Year-over-year growth 2021-2026 (%)
- Exhibit 95: Data Table on Brazil – Year-over-year growth 2021-2026 (%)
- 8.10 Japan – Market size and forecast 2021-2026
- Exhibit 96: Chart on Japan – Market size and forecast 2021-2026 ($ million)
- Exhibit 97: Data Table on Japan – Market size and forecast 2021-2026 ($ million)
- Exhibit 98: Chart on Japan – Year-over-year growth 2021-2026 (%)
- Exhibit 99: Data Table on Japan – Year-over-year growth 2021-2026 (%)
- 8.11 UK – Market size and forecast 2021-2026
- Exhibit 100: Chart on the UK – Market size and forecast 2021-2026 ($ million)
- Exhibit 101: Data Table on the UK – Market size and forecast 2021-2026 ($ million)
- Exhibit 102: Chart on the UK – Year-over-year growth 2021-2026 (%)
- Exhibit 103: Data Table on the UK – Year-over-year growth 2021-2026 (%)
- 8.12 China – Market size and forecast 2021-2026
- Exhibit 104: Chart on China – Market size and forecast 2021-2026 ($ million)
- Exhibit 105: Data Table on China – Market size and forecast 2021-2026 ($ million)
- Exhibit 106: Chart on China – Year-over-year growth 2021-2026 (%)
- Exhibit 107: Data Table on China – Year-over-year growth 2021-2026 (%)
- 8.13 Market opportunity by geography
- Exhibit 108: Market opportunity by geography ($ million)
9 Drivers, Challenges, and Trends
- 9.1 Market drivers
- 9.2 Market challenges
- 9.3 Impact of drivers and challenges
- Exhibit 109: Impact of drivers and challenges in 2021 and 2026
- 9.4 Market trends
10 Vendor Landscape
- 10.1 Overview
- 10.2 Vendor landscape
- Exhibit 110: Overview on Criticality of inputs and Factors of differentiation
- 10.3 Landscape disruption
- Exhibit 111: Overview on factors of disruption
- 10.4 Industry risks
- Exhibit 112: Impact of key risks on business
11 Vendor Analysis
- 11.1 Vendors covered
- Exhibit 113: Vendors covered
- 11.2 Market positioning of vendors
- Exhibit 114: Matrix on vendor position and classification
- 11.3 Amway Corp.
- Exhibit 115: Amway Corp. – Overview
- Exhibit 116: Amway Corp. – Product / Service
- Exhibit 117: Amway Corp. – Key offerings
- 11.4 Chatters Ltd. Partnership
- Exhibit 118: Chatters Ltd. Partnership – Overview
- Exhibit 119: Chatters Ltd. Partnership – Product / Service
- Exhibit 120: Chatters Ltd. Partnership – Key offerings
- 11.5 Coty Inc.
- Exhibit 121: Coty Inc. – Overview
- Exhibit 122: Coty Inc. – Business segments
- Exhibit 123: Coty Inc. – Key offerings
- Exhibit 124: Coty Inc. – Segment focus
- 11.6 The Estee Lauder Co. Inc.
- Exhibit 125: The Estee Lauder Co. Inc. – Overview
- Exhibit 126: The Estee Lauder Co. Inc. – Business segments
- Exhibit 127: The Estee Lauder Co. Inc. – Key news
- Exhibit 128: The Estee Lauder Co. Inc. – Key offerings
- Exhibit 129: The Estee Lauder Co. Inc. – Segment focus
- 11.7 Godrej and Boyce Manufacturing Co. Ltd.
- Exhibit 130: Godrej and Boyce Manufacturing Co. Ltd. – Overview
- Exhibit 131: Godrej and Boyce Manufacturing Co. Ltd. – Business segments
- Exhibit 132: Godrej and Boyce Manufacturing Co. Ltd. – Key offerings
- Exhibit 133: Godrej and Boyce Manufacturing Co. Ltd. – Segment focus
- 11.8 Henkel AG and Co. KGaA
- Exhibit 134: Henkel AG and Co. KGaA – Overview
- Exhibit 135: Henkel AG and Co. KGaA – Business segments
- Exhibit 136: Henkel AG and Co. KGaA – Key news
- Exhibit 137: Henkel AG and Co. KGaA – Key offerings
- Exhibit 138: Henkel AG and Co. KGaA – Segment focus
- 11.9 John Paul Mitchell Systems
- Exhibit 139: John Paul Mitchell Systems – Overview
- Exhibit 140: John Paul Mitchell Systems – Product / Service
- Exhibit 141: John Paul Mitchell Systems – Key offerings
- 11.10 Kao Corp.
- Exhibit 142: Kao Corp. – Overview
- Exhibit 143: Kao Corp. – Business segments
- Exhibit 144: Kao Corp. – Key offerings
- Exhibit 145: Kao Corp. – Segment focus
- 11.11 LOreal SA
- Exhibit 146: LOreal SA – Overview
- Exhibit 147: LOreal SA – Business segments
- Exhibit 148: LOreal SA – Key news
- Exhibit 149: LOreal SA – Key offerings
- Exhibit 150: LOreal SA – Segment focus
- 11.12 Madison Reed Inc.
- Exhibit 151: Madison Reed Inc. – Overview
- Exhibit 152: Madison Reed Inc. – Product / Service
- Exhibit 153: Madison Reed Inc. – Key offerings
12 Appendix
- 12.1 Scope of the report
- 12.2 Inclusions and exclusions checklist
- Exhibit 154: Inclusions checklist
- Exhibit 155: Exclusions checklist
- 12.3 Currency conversion rates for US$
- Exhibit 156: Currency conversion rates for US$
- 12.4 Research methodology
- Exhibit 157: Research methodology
- Exhibit 158: Validation techniques employed for market sizing
- Exhibit 159: Information sources
- 12.5 List of abbreviations
- Exhibit 160: List of abbreviations
Technavio is a leading global technology research and advisory company. Their research and analysis focus on emerging market trends and provide actionable insights to help businesses identify market opportunities and develop effective strategies to optimize their market positions. With over 500 specialized analysts, Technavio’s report library consists of more than 17,000 reports and counting, covering 800 technologies, spanning 50 countries. Their client base consists of enterprises of all sizes, including more than 100 Fortune 500 companies. This growing client base relies on Technavio’s comprehensive coverage, extensive research, and actionable market insights to identify opportunities in existing and potential markets and assess their competitive positions within changing market scenarios.
Technavio Research
Jesse Maida
Media & Marketing Executive
US: +1 844 364 1100
UK: +44 203 893 3200
Email: media@technavio.com
Website: www.technavio.com/
![]()
![]() View original content to download multimedia:https://www.prnewswire.com/news-releases/global-hair-color-market-30-of-growth-to-originate-from-europe-market-driven-by-innovation-in-product-formulation–formats—technavio-301600835.html
View original content to download multimedia:https://www.prnewswire.com/news-releases/global-hair-color-market-30-of-growth-to-originate-from-europe-market-driven-by-innovation-in-product-formulation–formats—technavio-301600835.html
SOURCE Technavio

Source link
The content is by PR Newswire. Headlines of Today Media is not responsible for the content provided or any links related to this content. Headlines of Today Media is not responsible for the correctness, topicality or the quality of the content.