
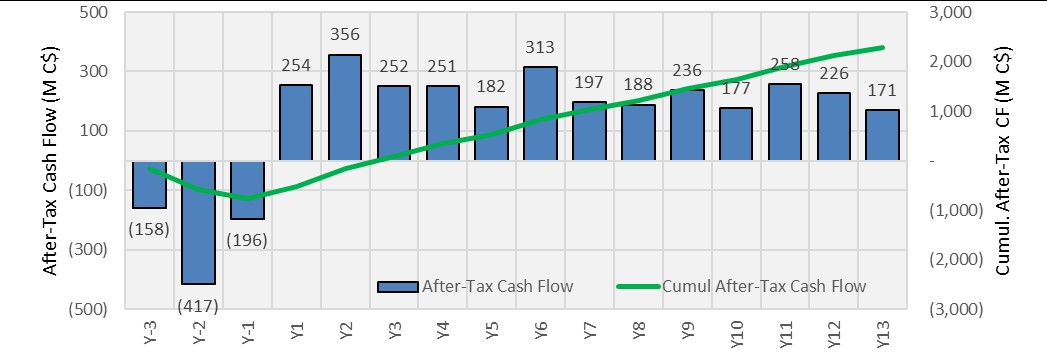
After-Tax NPV6% $1.16 Billion, IRR of 26%, Payback 2.3 years
TORONTO–(BUSINESS WIRE)–$GENM #copper–Generation Mining Limited (TSX: GENM; OTCQB: GENMF) (“Gen Mining” or the “Company”) is pleased to announce positive results on the updated Feasibility Study (“2023 FS” or the “Feasibility Study”) for the Marathon Palladium-Copper Project (the “Project”) located near the Town of Marathon in Northwestern Ontario. The 2023 FS presents an optimized design for the Project with improved clarity on anticipated capital and operating costs in the current inflationary environment. The 2023 FS outlines the operation of an open pit mine and process plant over a mine life of 12.5 years and replaces the Company’s March 2021 Feasibility Study (the “2021 FS”).
![]()
All dollar amounts are in Canadian dollars unless otherwise stated. All references to Mlbs are to millions of pounds and Moz are to millions of ounces and koz are to thousands of ounces.
Highlights:
- Robust economics1: An after-tax Net Present Value (“NPV”) at a 6% discount rate of $1.16 billion and Internal Rate of Return (“IRR”) of 25.8% based on a long-term price of US$1,800/oz for palladium and US$3.70/lb for copper
- Quick payback period on Initial Capital2,3: 2.3 years
- Initial Capital: $1,112 million ($898 million net of equipment financing and pre-commercial production revenue), an increase of 25% from the 2021 FS
- Low Operating Costs and attractive AISC: Life of mine (“LOM”) average operating costs of US$709/PdEq oz and all-in sustaining costs (“AISC”) of US$813/PdEq oz 3 . Operating costs have increased 14% compared with the 2021 FS.
- Increased Mineral Reserve Estimate: an increase of 8.5% in Mineral Reserves tonnages and a decreased open pit strip ratio
- Optimized operation: increased process plant throughput and improved metallurgical recoveries over LOM
- Average annual payable metals: 166 koz palladium, 41 Mlbs copper, 38 koz platinum, 12 koz gold and 248 koz silver
- LOM payable metals: 2.1 Moz palladium, 517 Mlbs copper, 485 koz platinum, 158 koz gold and 3.2 Moz silver
- Strong cash flows in first three years of production following commercial production: $851 million of free cash flow 3 , 580 koz of payable palladium and 132 Mlbs of payable copper
- Jobs: Creation of over 800 jobs during construction jobs and over 400 direct permanent jobs during operations
Jamie Levy, President and CEO of the Company, commented, “This updated Feasibility Study underscores just how robust the Marathon Project is, even in the current inflationary environment. This, combined with strong demand for critical minerals, makes the rationale for the Project becoming Canada’s next critical minerals mine more compelling than ever before. With the receipt of our Environmental Assessment approvals and our recently announced indicative offtake term sheets, we are advancing to arrange Project financing and working hard to obtain the permits necessary to start construction. The Project promises to be a near-term sustainable, environmentally sensitive, low-cost producer of critical metals that Canada and the rest of the world desperately need. On a copper equivalent basis, the Marathon Project, once in production, is expected to be one of the lowest CO2 equivalent intensity mines in the world. The metals we plan to produce will not only support emissions controls and the transition to a greener economy in Ontario and Canada, but they will also support job creation and economic prosperity for local, regional, and national stakeholders, in particular the First Nation community of Biigtigong Nishnaabeg and the Town of Marathon.”
Following the 2021 Feasibility Study, the Company undertook considerable work to optimize and de-risk the Project, including:
- Detailed engineering on the process plant, Tailing Storage Facility (“TSF”), and site infrastructure designs.
- Additional metallurgical test program to optimize the flowsheet and plant design and improve confidence in metallurgical recoveries. Results allowed the Company to remove the PGM-Scavenger circuit from the process plant design and lower the process plant unit-operating costs.
- Geotechnical investigations completed in areas of key infrastructure location and confirmed the locations chosen in the construction design.
- Additional diamond drilling of 18,995 m within the Marathon Deposit targeting key areas within the open pit Mineral Reserves in the first three years of planned production, and areas within and proximal to the overall Mineral Resources.
- Agreement finalized with Hycroft Mining Holding Corporation (“Hycroft”) for the purchase of an unused, surplus SAG mill and an unused, surplus ball mill4, which together with ancillary equipment allows the Company to increase throughput by 10% in the second full year of production.
- Community Benefits Agreement (“CBA”) signed and ratified with the Biigtigong Nishnaabeg (“BN”), on November 12, 2022.
- Federal and Provincial Environmental Assessment approvals received on November 30, 2022.
- Initiated the process of obtaining various federal and provincial permits and approvals required to construct and operate the project.
Drew Anwyll, P.Eng, Chief Operating Officer, said, “Our team has been working hard to develop the Marathon Project and has successfully optimized and improved confidence in the designs of the process plant, the open pits and the necessary infrastructure for the Project. Detailed design will advance, and we will continue to de-risk the Project in anticipation of finalizing the Project financing and receiving approval of the required permits to commence construction later in 2023.”
Upcoming Webinar:
For more information on the updated Feasibility Study please join Jamie Levy, President, Chief Executive Officer and Director, Kerry Knoll, Chairman and Director, and Drew Anwyll, Chief Operating Officer for a live event on Monday, April 3, 2023 at 10 am ET / 7 am PT. An opportunity to ask questions will follow the presentation. Click here to register: https://my.6ix.com/n9qfF5Nz
The Feasibility Study was prepared by the Company and G Mining Services Inc. (“GMS”), along with contributions from Wood Canada Limited, Knight Piésold Ltd., P&E Mining Consultants Inc. (“P&E”), and JDS Energy and Mining, Inc., and with support from LQ Consulting and Management Inc. and Haggarty Technical Services. The effective date of the Feasibility Study is December 31, 2022.
KEY RESULTS AND ASSUMPTIONS IN UPDATED FEASIBILITY STUDY
Key results and assumptions for the updated Feasibility Study are summarized below.
|
|
Units |
2023 FS |
2021 FS |
|
Production Data |
|||
|
Mine Life (operating) |
years |
12.5 |
12.8 |
|
Average Process Plant Throughput |
tpd |
27,700 |
25,200 |
|
Average Process Plant Throughput |
Mt/year |
10.1 |
9.2 |
|
Average Mining Rate |
tpd |
115,000 |
110,000 |
|
Average Mining Rate |
Mt/year |
42 |
40 |
|
Total Ore Mined |
Mt |
127 |
118 |
|
Strip Ratio |
waste:ore |
2.63 |
2.80 |
|
Palladium (payable) |
k oz |
2,122 |
1,905 |
|
Copper (payable) |
M lbs |
517 |
467 |
|
Platinum (payable) |
k oz |
485 |
537 |
|
Gold (payable) |
k oz |
158 |
151 |
|
Silver (payable) |
k oz |
3,156 |
2,823 |
|
LOM Palladium Equivalent Payable |
PdEq. koz |
3,613 |
3,195 |
|
Average Annual Palladium – Payable Metal |
k oz |
166 |
149 |
|
Average Annual Copper – Payable Metal |
M lbs |
41 |
36 |
|
Average Annual Platinum – Payable Metal |
k oz |
38 |
41 |
|
Average Annual Gold – Payable Metal |
k oz |
12 |
12 |
|
Average Annual Silver – Payable Metal |
k oz |
248 |
220 |
|
Operating Costs (Average LOM) |
|||
|
Mininga |
$/t mined |
3.25 |
2.53 |
|
Mining |
$/t milled |
11.45 |
9.23 |
|
Processing |
$/t milled |
8.70 |
9.08 |
|
G&Ab |
$/t milled |
2.67 |
2.48 |
|
Transport & Refining Charges |
$/t milled |
4.13 |
2.80 |
|
Royalty |
$/t milled |
0.09 |
0.04 |
|
Total Operating Cost |
$/t milled |
27.04 |
23.63 |
|
LOM Average Operating Costs |
US$/oz PdEq |
709 |
687 |
|
LOM Average AISCc |
US$/oz PdEq |
813 |
809 |
|
Capital Costs |
|||
|
Initial Capital |
$M |
1,112 |
888 |
|
Less: |
|
|
|
|
Pre-commercial production revenue |
$M |
($156) |
($171) |
|
Leased equipment, net of lease payments during construction |
$M |
($58) |
($53) |
|
Initial Capital (Adjusted) |
$M |
898 |
665 |
|
LOM Sustaining Capital |
$M |
424 |
423 |
|
Closure Costs |
$M |
72 |
66 |
|
Financial Evaluation |
|||
|
Pre-Tax Cash Flow (undiscounted) |
$M |
3,387 |
3,004 |
|
Pre-Tax NPV6% |
$M |
1,798 |
1,636 |
|
Pre-Tax IRR |
% |
31.9 |
38.6 |
|
Payback |
years |
2.0 |
1.9 |
|
Net Cash Flow (undiscounted) |
$M |
2,285 |
2,060 |
|
After-Tax NPV6% |
$M |
1,164 |
1,068 |
|
After-Tax IRR |
% |
25.8 |
29.7 |
|
Payback |
years |
2.3 |
2.3 |
|
Key Assumptionsd |
|||
|
Palladium Price |
US$/oz |
$1,800 |
$1,725 |
|
Copper Price |
US$/lb |
$3.70 |
$3.20 |
|
Platinum Price |
US$/oz |
$1,000 |
$1,000 |
|
Gold Price |
US$/oz |
$1,800 |
$1,400 |
|
Silver Price |
US$/oz |
$22.50 |
$20.00 |
|
Foreign Exchange (“FX”) |
C$:US$ |
1.35 |
1.28 |
|
Diesel Price |
$/litre |
1.17 |
0.77 |
|
Electricity |
$/kWhr |
0.07 |
0.08 |
|
Notes: a Including capitalized maintenance parts. b Includes estimated costs associated with certain commitments to and agreements with Indigenous communities. c AISC is calculated without the impact of the Precious Metal Purchase Agreement with Wheaton Precious Metals Corp. (“WPM PMPA”). d Metal Price Assumptions are based on the lesser of the three-year trailing average and the spot price on December 31, 2022, rounded to nearest interval. |
|||
|
LOM Metal Production |
Recovered Metal |
Payable Metal |
Revenue %a |
|
Palladium |
2,266 koz |
2,122 koz |
58 |
|
Copper |
548 Mlbs |
517 Mlbs |
29 |
|
Platinum |
607 koz |
485 koz |
7 |
|
Gold |
204 koz |
158 koz |
4 |
|
Silver |
4,529 koz |
3,156 koz |
1 |
|
Notes: a Excludes the impact of the WPM PMPA on gold and platinum revenues. |
|||
Mining
The Company will mine using conventional open pit, truck and shovel operating methods. Three open pits will be mined over the 12.5-year operating mine life, with an additional two years of pre-production mining to be undertaken where waste material is being mined for construction and ore stockpiling ahead of process plant commissioning. The mining equipment fleet is to be owner-operated and will include outsourcing of certain support activities such as explosives manufacturing and blasting. Production drilling and mining operations will take place on a 10 m bench height. The primary loading equipment will consist of 660 tonne hydraulic face shovels (29 m3 bucket size) and large front-end wheel loader (19 m3 bucket size). The loading fleet is matched with a fleet of 246 tonne haulage trucks. A fleet of 90 and 45 tonne excavators will be used to excavate the limited volume of overburden material and will also be allocated to mining the narrow-thickness ore zones, mainly associated with the W-Horizon in the South Pit, to mitigate additional dilution.
Peak mining production will be 43 Mt per year (118,000 tonnes per day (“t/d”)). Total material moved over the LOM is expected to be 460 Mt of which 128 Mt is ore.
The Marathon Deposit is well defined and characterized by ore outcropping on surface, with wide and moderately dipping mineralized zones.
The open pit operation includes a waste rock dump immediately to the east of the open pits and an ore stockpile (peak capacity of approximately 10 Mt) to the west of the pits, proximal to the crusher location.
Processing
The 2023 FS outlines the process plant throughput starting at 9.2 Mt per year (25,200 t/d) and increasing to 10.1 Mt per year (27,700 t/d) following the completion of the powerline upgrade scheduled year two of operations. The increase in process plant throughput is possible with the inclusion of the Hycroft mills in the plant design. The process plant will produce a copper-palladium concentrate (“Cu-PGM concentrate”).
The process plant flowsheet includes a conventional comminution circuit consisting of a SAG mill, followed by a ball mill (an “SAB” circuit). With the added capacity of the Hycroft mills, the pebble crusher (included in the 2021 FS) is no longer required. The flotation portion of the process plant includes rougher flotation, concentrate regrind and three stages of cleaning.
The process plant metallurgical recovery (at the average head grade) is estimated at an average of 88.0% palladium, 93.5% copper, 75.3% platinum, 71.5% gold and 66.4% silver. The phase 3 metallurgical test program demonstrated the PGM-Scavenger circuit outlined in the 2021 FS is no longer required.
The flotation circuit design was revised to replace the Direct Flotation Reactors previously included in the 2021 FS with conventional open tank cells for the roughers followed by Woodgrove Staged Flotation Reactors™ for the cleaning circuit. Concentrate thickening, concentrate filtering, tailings thickening, water management and a TSF complete the flowsheet.
Site Infrastructure
The existing regional infrastructure in the area of the Project is well established and will allow for the efficient logistics associated with Project execution and operations, including the movement of the Cu-PGM concentrate to a third-party off-site smelter.
All site infrastructure facilities, including the roads and access, process plant buildings, workshops, warehouse, administrative buildings, water treatment plants, explosives plant, communication systems, power and power transmission line required for the Project during construction and operation have been considered in the Project design. Off-site infrastructure (including transload concentrate facility, assay lab and accommodation units) required to support the operation have also been included.
The TSF design includes downstream constructed embankments using run-of-mine waste rockfill with embankments founded directly on bedrock. The majority of the TSF area consists of exposed bedrock with a thin intermittent layer of sand and gravel. The upstream face of the embankments includes an HDPE Geomembrane to minimize seepage. The construction methodology includes bulk material placement with the mining fleet. Associated with the TSF are separate water management facilities which will ensure the protection of the environment.
Between 2007 and 2022, there have been 10 geotechnical site investigation (“SI”) programs completed. The SI programs have focused on TSF foundation conditions and location of key site infrastructure, including the most recent drilling which focused on the process plant site, crusher, mine rock storage area and water management structures foundations. The recent and historical SI programs along with the 2021 detailed LiDAR™ topography and imagery survey have resulted in a good understanding of the geotechnical conditions for the Project.
Capital and Operating Cost Summary
The Initial Capital cost considers a construction timeframe of approximately 24 months followed by commissioning and ramp-up to commercial production5 over a period of approximately six months. During the pre-commercial production, the costs and revenue associated with operations will be capitalized and are included in the capital costs.
Construction Indirect costs and General and Owner’s costs are related to the expenses other than direct equipment purchases and direct construction costs.
Sustaining Capital items include future equipment purchases and replacements for the mining fleet and other site support equipment, the progressive build of the TSF over the LOM, and on and off-site infrastructure development to support the growth and contribute to operational improvements following initial construction.
The current capital cost estimate for the initial construction and the sustaining capital required during the LOM are shown in the table below. As noted above, this estimate represents a 25% ($224 million) increase to the initial construction capex reported in the 2021 FS. Within this increased capital cost, approximately 19% ($43 million) is due to scope changes, 71% ($160 million) is due to cost escalation and 10% ($22 million) with increased contingency.
|
Capital Costsa |
Initial ($M) |
Sustaining ($M) |
Total ($M) |
|
Mining and Surface Equipment |
117 |
130 |
247 |
|
Process Plant |
345 |
3 |
348 |
|
Infrastructure |
72 |
94 |
166 |
|
TSF, Water Management and Earthworks |
95 |
198 |
293 |
|
General and Owner’s Costs |
31 |
– |
31 |
|
Construction Indirects |
197 |
– |
197 |
|
Pre-production, Start-up and Commissioning |
159 |
– |
159 |
|
Contingencyb |
97 |
– |
97 |
|
Sub-Total |
1,112 |
424 |
1,537 |
|
Equipment Financing adjustment |
(58) |
– |
(58) |
|
Pre-Production Revenue |
(156) |
– |
(156) |
|
Total Capital (adjusted) |
898 |
424 |
1,322 |
|
Notes: a Sums in the table may not total due to rounding. b Contingency included at project sub-category basis and totals approximately 9.5%. |
|||
|
Operating Costs and AISC (LOM) |
$ M |
US$/oz PdEq |
|
Mining |
1,432 |
300 |
|
Process Plant |
1,087 |
228 |
|
General & Administration |
334 |
70 |
|
Concentrate Transport Costs |
230 |
48 |
|
Treatment & Refining Charges |
286 |
60 |
|
Royalties |
12 |
2 |
|
Total Operating Cost |
3,381 |
709 |
|
Closure & Reclamation |
72 |
15 |
|
Sustaining Capital |
424 |
89 |
|
All-in Sustaining Cost (AISC) |
3,878 |
813 |
Economic Analysis
The economic analysis is carried out in real terms (i.e., without inflation factors) in Q4 2022 Canadian Dollars without any project financing but inclusive of the WPM PMPA, and anticipated financing of mobile equipment and closure bonding.
To provide a better understanding of the economic impact of the WPM PMPA to the overall economics of the Project, the economic analysis is shown below including the economic impact of the WPM PMPA (as required under the National Instrument 43-101 Standards of Disclosure for Mineral Projects (“NI 43-101”) and excluding the economic impact of the WPM PMPA.
The economic analysis does not take into account any potential economic benefits which the Marathon Project may qualify for under the new 30% investment tax credit on machinery and equipment acquired to extract and process critical minerals which was announced by the Government of Canada in its March 28, 2023 Federal Budget.
|
ECONOMIC ANALYSIS |
UNITS |
INCLUDING WPM PMPA |
EXCLUDING WPM PMPA |
|
Pre-tax Undiscounted Cash Flow |
$M |
3,387 |
3,780 |
|
Pre-tax NPV (6%) |
$M |
1,798 |
1,979 |
|
Pre-tax IRR |
% |
31.9 |
29.8 |
|
Pre-tax Payback |
years |
2.0 |
2.3 |
|
After-tax Undiscounted Cash Flow |
$M |
2,285 |
2,562 |
|
After-tax NPV (6%) |
$M |
1,164 |
1,285 |
|
After-tax IRR |
% |
25.8 |
24.2 |
|
After-tax Payback |
years |
2.3 |
2.5 |
Sensitivities
The Project has significant leverage to palladium and copper prices. The after-tax valuation sensitivities for the key metrics are shown below.
|
Palladium Price US$/oz |
1,400 |
1,600 |
1,700 |
1,800 |
1,900 |
2,000 |
2,200 |
|
NPV6% ($M) |
696 |
930 |
1,047 |
1,164 |
1,282 |
1,400 |
1,634 |
|
Payback (yrs) |
3.3 |
2.9 |
2.5 |
2.3 |
2.2 |
2.0 |
1.9 |
|
IRR (%) |
18.5 |
22.3 |
24.0 |
25.8 |
27.5 |
29.1 |
32.3 |
|
Copper Price US$/lb |
2.50 |
3.00 |
3.50 |
3.70 |
3.90 |
4.50 |
5.00 |
|
NPV6% ($M) |
836 |
972 |
1,109 |
1,164 |
1,219 |
1,386 |
1,522 |
|
Payback (yrs) |
3.0 |
2.6 |
2.4 |
2.3 |
2.2 |
2.0 |
1.9 |
|
IRR (%) |
21.1 |
23.1 |
25.0 |
25.8 |
26.5 |
28.7 |
30.4 |
|
After-Tax Results |
OPEX Sensitivity |
||||
|
+30% |
+15% |
0% |
-15% |
-30% |
|
|
NPV 6% ($M) |
1,031 |
1,085 |
1,164 |
1,274 |
1,411 |
|
Payback (yrs) |
2.7 |
2.5 |
2.3 |
2.1 |
2.0 |
|
IRR (%) |
23.4 |
24.4 |
25.8 |
27.4 |
29.2 |
|
After-Tax Results |
CAPEX Sensitivity |
||||
|
+30% |
+15% |
0% |
-15% |
-30% |
|
|
NPV 6% ($M) |
932 |
1,048 |
1,164 |
1,281 |
1,397 |
|
Payback (yrs) |
3.3 |
3.0 |
2.3 |
1.9 |
1.3 |
|
IRR (%) |
18.4 |
21.6 |
25.8 |
31.6 |
40.1 |
|
Discount Rate Sensitivity (%) |
NPV (After-Tax) ($M) |
|
Foreign Exchange Rate C$:US$ |
NPV (After-Tax) ($M) |
|
0 |
2,285 |
1.25 |
928 |
|
|
5 |
1,303 |
1.30 |
1,046 |
|
|
6 |
1,164 |
1.35 |
1,164 |
|
|
8 |
925 |
1.40 |
1,284 |
|
|
10 |
731 |
1.45 |
1,403 |
|
Fuel Price Sensitivity (C$/litre) |
NPV (After-Tax) ($M) |
|
Power Price Sensitivity ($/kWhr) |
NPV (After-Tax) ($M) |
|
0.90 |
1,197 |
0.05 |
1,207 |
|
|
1.00 |
1,185 |
0.06 |
1,186 |
|
|
1.10 |
1,173 |
0.07 |
1,164 |
|
|
1.17 |
1,164 |
0.08 |
1,143 |
|
|
1.30 |
1,148 |
0.09 |
1,121 |
|
|
1.40 |
1,136 |
0.10 |
1,100 |
Mineral Resources
The Mineral Resource Estimate below is for the combined Marathon, Geordie and Sally deposits. The Mineral Resource Estimates for Geordie and Sally were prepared by P&E. The Mineral Resource Estimate for Marathon was prepared by Gen Mining and reviewed by P&E.
Pit Constrained Combined Mineral Resource Estimate a-jfor the Marathon, Geordie and Sally Deposits (Effective date December 31, 2022)
|
Mineral Classification |
Tonnes |
Pd |
Cu |
Pt |
Au |
Ag |
|||||
|
k |
g/t |
koz |
% |
M lbs |
g/t |
koz |
g/t |
koz |
g/t |
koz |
|
|
Marathon Deposit |
|||||||||||
|
Measured |
158,682 |
0.60 |
3,077 |
0.20 |
712 |
0.19 |
995 |
0.07 |
359 |
1.75 |
8,939 |
|
Indicated |
29,905 |
0.43 |
412 |
0.19 |
124 |
0.14 |
136 |
0.06 |
59 |
1.64 |
1,575 |
|
Meas. + Ind. |
188,587 |
0.58 |
3,489 |
0.20 |
836 |
0.19 |
1131 |
0.07 |
418 |
1.73 |
10,514 |
|
Inferred |
1,662 |
0.37 |
20 |
0.16 |
6 |
0.14 |
7 |
0.07 |
4 |
1.25 |
67 |
|
Geordie Deposit |
|||||||||||
|
Indicated |
17,268 |
0.56 |
312 |
0.35 |
133 |
0.04 |
20 |
0.05 |
25 |
2.4 |
1,351 |
|
Inferred |
12,899 |
0.51 |
212 |
0.28 |
80 |
0.03 |
12 |
0.03 |
14 |
2.4 |
982 |
|
Sally Deposit |
|||||||||||
|
Indicated |
24,801 |
0.35 |
278 |
0.17 |
93 |
0.2 |
160 |
0.07 |
56 |
0.7 |
567 |
|
Inferred |
14,019 |
0.28 |
124 |
0.19 |
57 |
0.15 |
70 |
0.05 |
24 |
0.6 |
280 |
|
Total Project |
|||||||||||
|
Measured |
158,682 |
0.60 |
3,077 |
0.20 |
712 |
0.19 |
995 |
0.07 |
359 |
1.75 |
8,939 |
|
Indicated |
71,974 |
0.43 |
1,002 |
0.22 |
350 |
0.14 |
316 |
0.06 |
140 |
1.5 |
3,493 |
|
Meas. + Ind. |
230,656 |
0.55 |
4,079 |
0.21 |
1,062 |
0.18 |
1,311 |
0.07 |
499 |
1.67 |
12,432 |
|
Inferred |
28,580 |
0.39 |
356 |
0.23 |
143 |
0.1 |
89 |
0.04 |
42 |
1.45 |
1,329 |
|
Notes:
|
|||||||||||
Mineral Reserves
The Mineral Reserve estimate for the Project includes only the Marathon Deposit. The Mineral Reserve Estimate was prepared by GMS.
Marathon Project Open Pit Mineral Reserve Estimatesa-i
(Effective Date of December 31, 2022)
|
Mineral Reserves |
Tonnes |
Pd |
Cu |
Pt |
Au |
Ag |
|||||
|
kt |
g/t |
koz |
% |
M lb |
g/t |
koz |
g/t |
koz |
g/t |
koz |
|
|
Proven |
114,798 |
0.65 |
2,382 |
0.21 |
530 |
0.20 |
744 |
0.07 |
259 |
1.68 |
6,191 |
|
Probable |
12,863 |
0.47 |
193 |
0.20 |
55 |
0.15 |
61 |
0.06 |
26 |
1.53 |
635 |
|
P & P |
127,662 |
0.63 |
2,575 |
0.21 |
586 |
0.20 |
806 |
0.07 |
285 |
1.66 |
6,825 |
|
Note:
|
|||||||||||
Community, Environment and Permitting
The Environmental Assessment for the Project was approved on November 30, 2022 in accordance with the Canadian Environmental Assessment Act and Ontario’s Environmental Assessment Act through a Joint Review Panel pursuant to the Canada-Ontario Agreement on Environmental Assessment Cooperation (2004).
Contacts
Jamie Levy
President and Chief Executive Officer
(416) 640-2934 (O)
(416) 567-2440 (M)
jlevy@genmining.com
Ann Wilkinson
Vice President, Investor Relations
(416) 640-2954 (O)
(416) 357-5511 (M)
awilkinson@genmining.com
Read full story here
Source link
The content is by Business Wire. Headlines of Today Media is not responsible for the content provided or any links related to this content. Headlines of Today Media is not responsible for the correctness, topicality or the quality of the content.