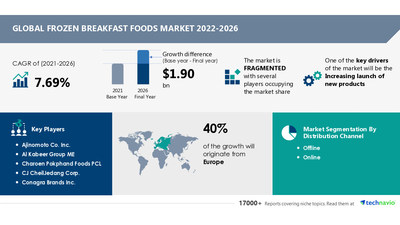
NEW YORK, Sept. 5, 2022 /PRNewswire/ — The latest market analysis report titled Frozen Breakfast Foods Market by Distribution Channel and Geography – Forecast and Analysis 2022-2026 has been added to Technavio’s catalog. The report predicts the market to witness an accelerating growth momentum at a CAGR of 7.69% during the projected period. The analysts at Technavio have categorized the global frozen breakfast foods market as a part of the global packaged foods and meats market. Our report provides extensive information on the value chain analysis for the frozen breakfast foods market, which vendors can leverage to gain a competitive advantage during the forecast period. The data available in our value chain analysis segment can help vendors drive costs and enhance customer services during the forecast period.

For more insights on the scope and value chain analysis, Read a FREE Sample Report
Frozen Breakfast Foods Market Dynamics
- Key Driver: The increasing launch of new products is one of the factors driving the frozen breakfast foods market growth. Nowadays, to attract more consumers and increase visibility in the market vendors are offering various types of frozen breakfast food products, backed by several new product launches. The initial launch included frozen bites, nuggets, and strips made with plants. Thus, an increase in product launches will drive market growth during the forecast period.
- Key Challenge: Frequent product recalls are one of the key factors limiting the frozen breakfast foods market growth. Product recall mainly occurs when they are found to include materials such as metal fragments, wood, and plastic. Moreover, in some cases products are recalled when they are not submitted for inspection or contain ingredients that are not mentioned in the product description. However, such product recalls may bring down the product’s reputation and thereby limit the market growth.
Request a FREE Sample Report for more market dynamics and their impact analysis
Frozen Breakfast Foods Market Segmentation
- Distribution Channel
- Offline: The frozen breakfast foods market share growth by the offline segment will be significant during the forecast period. The revenue of the offline distribution channel comes from the sales of products through specialty stores, hypermarkets, supermarkets, convenience stores, and department stores. Although the offline distribution channel is losing its market to the online channel, extensive marketing will leverage its sales at a steady rate. To gain an offline retail landscape, vendors are also implementing innovative strategies to attract their customers. Such efforts by vendors are expected to drive market growth during the forecast period.
- Online
- Geography
- Europe: 40% of the market’s growth will originate from Europe during the forecast period. Germany, the UK, and France are the key markets for frozen breakfast foods market in Europe. Market growth in this region will be faster than the growth of the market in other regions. The growing per capita spending of consumers on food will facilitate the frozen breakfast foods market growth in Europe over the forecast period.
- North America
- APAC
- Middle East And Africa
- South America
Grab a PDF Report Sample for segment-wise contribution and regional opportunities
Frozen Breakfast Foods Market Vendor Analysis and Scope
The frozen breakfast foods market is fragmented and the vendors are deploying growth strategies such as introducing products, expanding their presence through M&A, and launching marketing campaigns to compete in the market. This statistical study of the frozen breakfast foods market encompasses successful business strategies deployed by the key vendors. The frozen breakfast foods market forecast report offers in-depth insights into key vendor profiles. The profiles include information on the production, sustainability, and prospects of the leading companies. To make the most of the opportunities and recover from the pandemic, market vendors should focus more on the growth prospects in the fast-growing segments, while maintaining their positions in the slow-growing segments. Backed with competitive intelligence and benchmarking, our research reports on the frozen breakfast foods market are designed to provide entry support, customer profile & M&As as well as go-to-market strategy support.
The report also covers the following areas:
- Frozen Breakfast Foods Market size
- Frozen Breakfast Foods Market trends
- Frozen Breakfast Foods Market industry analysis
Frozen Breakfast Foods Market Highlights
- CAGR of the market during the forecast period 2022-2026
- Detailed information on factors that will assist frozen breakfast foods market growth during the next five years
- Estimation of the frozen breakfast foods market size and its contribution to the parent market
- Predictions on upcoming trends and changes in consumer behavior
- The growth of the frozen breakfast foods market
- Analysis of the market’s competitive landscape and detailed information on vendors
- Comprehensive details of factors that will challenge the growth of frozen breakfast foods market vendors
Related Reports:
Frozen Ready Meals Market by Product and Geography – Forecast and Analysis 2022-2026
Frozen Waffles Market by Product and Geography – Forecast and Analysis 2022-2026
Frozen Snack Food Market by Product and Geography – Forecast and Analysis 2022-2026
Frozen Food Market by Product and Geography – Forecast and Analysis 2021-2025
Frozen Food Market in India by Product and Distribution Channel – Forecast and Analysis 2022-2026
|
Frozen Breakfast Foods Market Scope |
|
|
Report Coverage |
Details |
|
Page number |
120 |
|
Base year |
2021 |
|
Forecast period |
2022-2026 |
|
Growth momentum & CAGR |
Accelerate at a CAGR of 7.69% |
|
Market growth 2022-2026 |
$ 1.90 billion |
|
Market structure |
Fragmented |
|
YoY growth (%) |
7.21 |
|
Regional analysis |
Europe, North America, APAC, Middle East and |
|
Performing market contribution |
Europe at 40% |
|
Key consumer countries |
US, Japan, Germany, UK, and France |
|
Competitive landscape |
Leading companies, competitive strategies, consumer |
|
Companies profiled
|
Ajinomoto Co. Inc., Al Kabeer Group ME,Charoen |
|
Market Dynamics
|
Parent market analysis, Market growth inducers and |
|
Customization purview
|
If our report has not included the data that you are |
Table of Content
1 Executive Summary
- 1.1 Market overview
- Exhibit 01: Executive Summary – Chart on Market Overview
- Exhibit 02: Executive Summary – Data Table on Market Overview
- Exhibit 03: Executive Summary – Chart on Global Market Characteristics
- Exhibit 04: Executive Summary – Chart on Market by Geography
- Exhibit 05: Executive Summary – Chart on Market Segmentation by Distribution Channel
- Exhibit 06: Executive Summary – Chart on Incremental Growth
- Exhibit 07: Executive Summary – Data Table on Incremental Growth
- Exhibit 08: Executive Summary – Chart on Vendor Market Positioning
2 Market Landscape
- 2.1 Market ecosystem
- Exhibit 09: Parent market
- Exhibit 10: Market Characteristics
3 Market Sizing
- 3.1 Market definition
- Exhibit 11: Offerings of vendors included in the market definition
- 3.2 Market segment analysis
- Exhibit 12: Market segments
- 3.3 Market size 2021
- 3.4 Market outlook: Forecast for 2021-2026
- Exhibit 13: Chart on Global – Market size and forecast 2021-2026 ($ million)
- Exhibit 14: Data Table on Global – Market size and forecast 2021-2026 ($ million)
- Exhibit 15: Chart on Global Market: Year-over-year growth 2021-2026 (%)
- Exhibit 16: Data Table on Global Market: Year-over-year growth 2021-2026 (%)
4 Five Forces Analysis
- 4.1 Five forces summary
- Exhibit 17: Five forces analysis – Comparison between 2021 and 2026
- 4.2 Bargaining power of buyers
- Exhibit 18: Chart on Bargaining power of buyers – Impact of key factors 2021 and 2026
- 4.3 Bargaining power of suppliers
- Exhibit 19: Bargaining power of suppliers – Impact of key factors in 2021 and 2026
- 4.4 Threat of new entrants
- Exhibit 20: Threat of new entrants – Impact of key factors in 2021 and 2026
- 4.5 Threat of substitutes
- Exhibit 21: Threat of substitutes – Impact of key factors in 2021 and 2026
- 4.6 Threat of rivalry
- Exhibit 22: Threat of rivalry – Impact of key factors in 2021 and 2026
- 4.7 Market condition
- Exhibit 23: Chart on Market condition – Five forces 2021 and 2026
5 Market Segmentation by Distribution Channel
- 5.1 Market segments
- Exhibit 24: Chart on Distribution Channel – Market share 2021-2026 (%)
- Exhibit 25: Data Table on Distribution Channel – Market share 2021-2026 (%)
- 5.2 Comparison by Distribution Channel
- Exhibit 26: Chart on Comparison by Distribution Channel
- Exhibit 27: Data Table on Comparison by Distribution Channel
- 5.3 Offline – Market size and forecast 2021-2026
- Exhibit 28: Chart on Offline – Market size and forecast 2021-2026 ($ million)
- Exhibit 29: Data Table on Offline – Market size and forecast 2021-2026 ($ million)
- Exhibit 30: Chart on Offline – Year-over-year growth 2021-2026 (%)
- Exhibit 31: Data Table on Offline – Year-over-year growth 2021-2026 (%)
- 5.4 Online – Market size and forecast 2021-2026
- Exhibit 32: Chart on Online – Market size and forecast 2021-2026 ($ million)
- Exhibit 33: Data Table on Online – Market size and forecast 2021-2026 ($ million)
- Exhibit 34: Chart on Online – Year-over-year growth 2021-2026 (%)
- Exhibit 35: Data Table on Online – Year-over-year growth 2021-2026 (%)
- 5.5 Market opportunity by Distribution Channel
- Exhibit 36: Market opportunity by Distribution Channel ($ million)
6 Customer Landscape
- 6.1 Customer landscape overview
- Exhibit 37: Analysis of price sensitivity, lifecycle, customer purchase basket, adoption rates, and purchase criteria
7 Geographic Landscape
- 7.1 Geographic segmentation
- Exhibit 38: Chart on Market share by geography 2021-2026 (%)
- Exhibit 39: Data Table on Market share by geography 2021-2026 (%)
- 7.2 Geographic comparison
- Exhibit 40: Chart on Geographic comparison
- Exhibit 41: Data Table on Geographic comparison
- 7.3 Europe – Market size and forecast 2021-2026
- Exhibit 42: Chart on Europe – Market size and forecast 2021-2026 ($ million)
- Exhibit 43: Data Table on Europe – Market size and forecast 2021-2026 ($ million)
- Exhibit 44: Chart on Europe – Year-over-year growth 2021-2026 (%)
- Exhibit 45: Data Table on Europe – Year-over-year growth 2021-2026 (%)
- 7.4 North America – Market size and forecast 2021-2026
- Exhibit 46: Chart on North America – Market size and forecast 2021-2026 ($ million)
- Exhibit 47: Data Table on North America – Market size and forecast 2021-2026 ($ million)
- Exhibit 48: Chart on North America – Year-over-year growth 2021-2026 (%)
- Exhibit 49: Data Table on North America – Year-over-year growth 2021-2026 (%)
- 7.5 APAC – Market size and forecast 2021-2026
- Exhibit 50: Chart on APAC – Market size and forecast 2021-2026 ($ million)
- Exhibit 51: Data Table on APAC – Market size and forecast 2021-2026 ($ million)
- Exhibit 52: Chart on APAC – Year-over-year growth 2021-2026 (%)
- Exhibit 53: Data Table on APAC – Year-over-year growth 2021-2026 (%)
- 7.6 Middle East and Africa – Market size and forecast 2021-2026
- Exhibit 54: Chart on Middle East and Africa – Market size and forecast 2021-2026 ($ million)
- Exhibit 55: Data Table on Middle East and Africa – Market size and forecast 2021-2026 ($ million)
- Exhibit 56: Chart on Middle East and Africa – Year-over-year growth 2021-2026 (%)
- Exhibit 57: Data Table on Middle East and Africa – Year-over-year growth 2021-2026 (%)
- 7.7 South America – Market size and forecast 2021-2026
- Exhibit 58: Chart on South America – Market size and forecast 2021-2026 ($ million)
- Exhibit 59: Data Table on South America – Market size and forecast 2021-2026 ($ million)
- Exhibit 60: Chart on South America – Year-over-year growth 2021-2026 (%)
- Exhibit 61: Data Table on South America – Year-over-year growth 2021-2026 (%)
- 7.8 US – Market size and forecast 2021-2026
- Exhibit 62: Chart on US – Market size and forecast 2021-2026 ($ million)
- Exhibit 63: Data Table on US – Market size and forecast 2021-2026 ($ million)
- Exhibit 64: Chart on US – Year-over-year growth 2021-2026 (%)
- Exhibit 65: Data Table on US – Year-over-year growth 2021-2026 (%)
- 7.9 Germany – Market size and forecast 2021-2026
- Exhibit 66: Chart on Germany – Market size and forecast 2021-2026 ($ million)
- Exhibit 67: Data Table on Germany – Market size and forecast 2021-2026 ($ million)
- Exhibit 68: Chart on Germany – Year-over-year growth 2021-2026 (%)
- Exhibit 69: Data Table on Germany – Year-over-year growth 2021-2026 (%)
- 7.10 UK – Market size and forecast 2021-2026
- Exhibit 70: Chart on UK – Market size and forecast 2021-2026 ($ million)
- Exhibit 71: Data Table on UK – Market size and forecast 2021-2026 ($ million)
- Exhibit 72: Chart on UK – Year-over-year growth 2021-2026 (%)
- Exhibit 73: Data Table on UK – Year-over-year growth 2021-2026 (%)
- 7.11 Japan – Market size and forecast 2021-2026
- Exhibit 74: Chart on Japan – Market size and forecast 2021-2026 ($ million)
- Exhibit 75: Data Table on Japan – Market size and forecast 2021-2026 ($ million)
- Exhibit 76: Chart on Japan – Year-over-year growth 2021-2026 (%)
- Exhibit 77: Data Table on Japan – Year-over-year growth 2021-2026 (%)
- 7.12 France – Market size and forecast 2021-2026
- Exhibit 78: Chart on France – Market size and forecast 2021-2026 ($ million)
- Exhibit 79: Data Table on France – Market size and forecast 2021-2026 ($ million)
- Exhibit 80: Chart on France – Year-over-year growth 2021-2026 (%)
- Exhibit 81: Data Table on France – Year-over-year growth 2021-2026 (%)
- 7.13 Market opportunity by geography
- Exhibit 82: Market opportunity by geography ($ million)
8 Drivers, Challenges, and Trends
- 8.1 Market drivers
- 8.2 Market challenges
- 8.3 Impact of drivers and challenges
- Exhibit 83: Impact of drivers and challenges in 2021 and 2026
- 8.4 Market trends
9 Vendor Landscape
- 9.1 Overview
- 9.2 Vendor landscape
- Exhibit 84: Overview on Criticality of inputs and Factors of differentiation
- 9.3 Landscape disruption
- Exhibit 85: Overview on factors of disruption
- 9.4 Industry risks
- Exhibit 86: Impact of key risks on business
10 Vendor Analysis
- 10.1 Vendors covered
- Exhibit 87: Vendors covered
- 10.2 Market positioning of vendors
- Exhibit 88: Matrix on vendor position and classification
- 10.3 Ajinomoto Co. Inc.
- Exhibit 89: Ajinomoto Co. Inc. – Overview
- Exhibit 90: Ajinomoto Co. Inc. – Business segments
- Exhibit 91: Ajinomoto Co. Inc. – Key news
- Exhibit 92: Ajinomoto Co. Inc. – Key offerings
- Exhibit 93: Ajinomoto Co. Inc. – Segment focus
- 10.4 Al Kabeer Group ME
- Exhibit 94: Al Kabeer Group ME – Overview
- Exhibit 95: Al Kabeer Group ME – Product / Service
- Exhibit 96: Al Kabeer Group ME – Key offerings
- 10.5 Charoen Pokphand Foods PCL
- Exhibit 97: Charoen Pokphand Foods PCL – Overview
- Exhibit 98: Charoen Pokphand Foods PCL – Business segments
- Exhibit 99: Charoen Pokphand Foods PCL – Key news
- Exhibit 100: Charoen Pokphand Foods PCL – Key offerings
- Exhibit 101: Charoen Pokphand Foods PCL – Segment focus
- 10.6 CJ CheilJedang Corp.
- Exhibit 102: CJ CheilJedang Corp. – Overview
- Exhibit 103: CJ CheilJedang Corp. – Business segments
- Exhibit 104: CJ CheilJedang Corp. – Key offerings
- Exhibit 105: CJ CheilJedang Corp. – Segment focus
- 10.7 Conagra Brands Inc.
- Exhibit 106: Conagra Brands Inc. – Overview
- Exhibit 107: Conagra Brands Inc. – Business segments
- Exhibit 108: Conagra Brands Inc. – Key news
- Exhibit 109: Conagra Brands Inc. – Key offerings
- Exhibit 110: Conagra Brands Inc. – Segment focus
- 10.8 Dr. August Oetker KG
- Exhibit 111: Dr. August Oetker KG – Overview
- Exhibit 112: Dr. August Oetker KG – Product / Service
- Exhibit 113: Dr. August Oetker KG – Key news
- Exhibit 114: Dr. August Oetker KG – Key offerings
- 10.9 General Mills Inc.
- Exhibit 115: General Mills Inc. – Overview
- Exhibit 116: General Mills Inc. – Business segments
- Exhibit 117: General Mills Inc. – Key news
- Exhibit 118: General Mills Inc. – Key offerings
- Exhibit 119: General Mills Inc. – Segment focus
- 10.10 Grupo Bimbo SAB de CV
- Exhibit 120: Grupo Bimbo SAB de CV – Overview
- Exhibit 121: Grupo Bimbo SAB de CV – Business segments
- Exhibit 122: Grupo Bimbo SAB de CV – Key news
- Exhibit 123: Grupo Bimbo SAB de CV – Key offerings
- Exhibit 124: Grupo Bimbo SAB de CV – Segment focus
- 10.11 International Food and Consumable Goods Egypt SAE
- Exhibit 125: International Food and Consumable Goods Egypt SAE – Overview
- Exhibit 126: International Food and Consumable Goods Egypt SAE – Product / Service
- Exhibit 127: International Food and Consumable Goods Egypt SAE – Key offerings
- 10.12 McCain Foods Ltd.
- Exhibit 128: McCain Foods Ltd. – Overview
- Exhibit 129: McCain Foods Ltd. – Product / Service
- Exhibit 130: McCain Foods Ltd. – Key offerings
11 Appendix
- 11.1 Scope of the report
- 11.2 Inclusions and exclusions checklist
- Exhibit 131: Inclusions checklist
- Exhibit 132: Exclusions checklist
- 11.3 Currency conversion rates for US$
- Exhibit 133: Currency conversion rates for US$
- 11.4 Research methodology
- Exhibit 134: Research methodology
- Exhibit 135: Validation techniques employed for market sizing
- Exhibit 136: Information sources
- 11.5 List of abbreviations
- Exhibit 137: List of abbreviations
About Us
Technavio is a leading global technology research and advisory company. Their research and analysis focus on emerging market trends and provide actionable insights to help businesses identify market opportunities and develop effective strategies to optimize their market positions. With over 500 specialized analysts, Technavio’s report library consists of more than 17,000 reports and counting, covering 800 technologies, spanning 50 countries. Their client base consists of enterprises of all sizes, including more than 100 Fortune 500 companies. This growing client base relies on Technavio’s comprehensive coverage, extensive research, and actionable market insights to identify opportunities in existing and potential markets and assess their competitive positions within changing market scenarios.
Contact
Technavio Research
Jesse Maida
Media & Marketing Executive
US: +1 844 364 1100
UK: +44 203 893 3200
Email: media@technavio.com
Website: www.technavio.com/
![]()
![]() View original content to download multimedia:https://www.prnewswire.com/news-releases/frozen-breakfast-foods-market-size-to-grow-by-usd-1-90-billion-with-40-contribution-from-europe—technavio-301617455.html
View original content to download multimedia:https://www.prnewswire.com/news-releases/frozen-breakfast-foods-market-size-to-grow-by-usd-1-90-billion-with-40-contribution-from-europe—technavio-301617455.html
SOURCE Technavio

Source link
The content is by PR Newswire. Headlines of Today Media is not responsible for the content provided or any links related to this content. Headlines of Today Media is not responsible for the correctness, topicality or the quality of the content.