NEW YORK, Feb. 3, 2023 /PRNewswire/ — The UK is the leading market in Europe and contributes to the top education services among the different countries. The UK Educational Services sector comprises establishments that provide instruction and training in a wide variety of subjects. This instruction and training are provided by specialized establishments, such as schools, colleges, universities, and training centers. In the wake of the pandemic in 2020, most institutions of higher education have shuttered their physical campuses for the academic year and moved their summer sessions online. To know more – Buy the Report

In 2020, due to the outbreak of COVID-19, governments of several countries imposed nationwide lockdowns. These lockdowns led to the closure of academic institutes, schools, universities, and offices for several months to contain the spread of the disease. As a result, the demand for online courses increased. Owing to the lockdowns, students had enough time to strengthen their talents. Moreover, various ed-tech companies made some of their courses free to attract students who wanted to learn cutting-edge technologies. For more insights – Download a Sample Report!
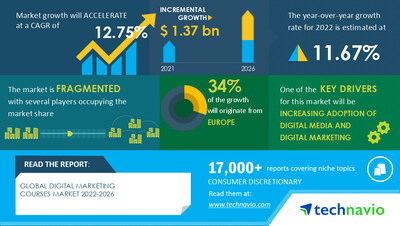
The UK is one of the top key country contributors to the global digital marketing courses market. The market is segmented by courses (academic courses and certification courses) and geography (Europe, North America, APAC, South America, and Middle East and Africa). The global digital marketing courses market is estimated to grow at a CAGR of 12.75% between 2021 and 2026. The size of the market is forecasted to increase by USD 1.37 billion.
The major vendors for the global digital marketing courses market include Alibaba Group Holding Ltd., Alphabet Inc., Amazon.com Inc., ClickMinded LLC, Coursera Inc., Digital Marketing Institute Ltd., Engaging Ideas Pvt. Ltd., HubSpot Inc., Manipal Academy of Higher Education, Meta Platforms Inc., NIIT Ltd., Rainmaker Digital LLC, Reliablesoft.Net, Retyp LLC, SEMrush Inc., Simplilearn Solutions Pvt. Ltd., The Digital Sandbox, Udacity Inc., and Udemy Inc. among others. To know about the vendor offerings, Request a PDF Sample!
The increasing adoption of digital media and digital marketing is notably driving the digital marketing courses market growth, although factors such as the advent of open-source materials and courses may impede market growth.
Gain instant access to 17,000+ market research reports.
Technavio’s SUBSCRIPTION platform
Related Reports –
- The digital content market is estimated to grow at a CAGR of 13.78% between 2022 and 2027. The size of the market is forecasted to increase by USD 694.88 billion. The digital content market report offers information on several market vendors, including Activision Blizzard Inc., Alphabet Inc., Amazon.com Inc., Apple Inc., AT and T Inc., Baidu Inc., Bloomberg L.P, Comcast Corp., Deezer SA, DISH Network Corp., Electronic Arts Inc., Gannett Co. Inc., iHeartMedia Inc., Microsoft Corp., Netflix Inc.
- The predicted growth for the digital education content market size from 2021 to 2026 is USD 47.10 billion at a progressing CAGR of 11.94%. The report offers information on several market vendors, including Adobe Inc., Ambow Education Holding Ltd., Apollo Global Management Inc., Articulate Global Inc., Cambridge University Press, Cengage Learning Holdings II Inc., Coursera Inc.
Digital Marketing Courses Market 2022-2026: Key Highlights
- CAGR of the market during the forecast period 2022-2026
- Detailed information on factors that will drive digital marketing courses market growth during the next five years
- Precise estimation of the digital marketing courses market size and its contribution to the parent market
- Accurate predictions on upcoming trends and changes in consumer behavior
- The growth of the digital marketing courses industry across Europe, North America, APAC, South America, and Middle East and Africa
- A thorough analysis of the market’s competitive landscape and detailed information on vendors
- Comprehensive details of factors that will challenge the growth of digital marketing courses market vendors
|
Digital Marketing Courses Market Scope |
|
|
Report Coverage |
Details |
|
Page number |
135 |
|
Base year |
2021 |
|
Forecast period |
2022-2026 |
|
Growth momentum & CAGR |
Accelerate at a CAGR of 12.75% |
|
Market growth 2022-2026 |
USD 1.37 billion |
|
Market structure |
Fragmented |
|
YoY growth 2021-2022 (%) |
11.67 |
|
Regional analysis |
Europe, North America, APAC, South America, and Middle East and Africa |
|
Performing market contribution |
Europe at 34% |
|
Key consumer countries |
US, Canada, China, UK, and Germany |
|
Competitive landscape |
Leading companies, competitive strategies, consumer engagement scope |
|
Key companies profiled |
Alibaba Group Holding Ltd., Alphabet Inc., Amazon.com Inc., ClickMinded LLC, Coursera Inc., Digital Marketing Institute Ltd., Engaging Ideas Pvt. Ltd., HubSpot Inc., Manipal Academy of Higher Education, Meta Platforms Inc., NIIT Ltd., Rainmaker Digital LLC, Reliablesoft.Net, Retyp LLC, SEMrush Inc., Simplilearn Solutions Pvt. Ltd., The Digital Sandbox, Udacity Inc., and Udemy Inc. |
|
Market dynamics |
Parent market analysis, market growth inducers and obstacles, fast-growing and slow-growing segment analysis, COVID-19 impact and recovery analysis and future consumer dynamics, and market condition analysis for the forecast period. |
|
Customization purview |
If our report has not included the data that you are looking for, you can reach out to our analysts and get segments customized. |
Browse for Technavio’s consumer discretionary market reports
Table of contents
1 Executive Summary
- 1.1 Market overview
- Exhibit 01: Executive Summary – Chart on Market Overview
- Exhibit 02: Executive Summary – Data Table on Market Overview
- Exhibit 03: Executive Summary – Chart on Global Market Characteristics
- Exhibit 04: Executive Summary – Chart on Market by Geography
- Exhibit 05: Executive Summary – Chart on Market Segmentation by Courses
- Exhibit 06: Executive Summary – Chart on Incremental Growth
- Exhibit 07: Executive Summary – Data Table on Incremental Growth
- Exhibit 08: Executive Summary – Chart on Vendor Market Positioning
2 Market Landscape
- 2.1 Market ecosystem
- Exhibit 09: Parent market
- Exhibit 10: Market Characteristics
3 Market Sizing
- 3.1 Market definition
- Exhibit 11: Offerings of vendors included in the market definition
- 3.2 Market segment analysis
- Exhibit 12: Market segments
- 3.3 Market size 2021
- 3.4 Market outlook: Forecast for 2021-2026
- Exhibit 13: Chart on Global – Market size and forecast 2021-2026 ($ million)
- Exhibit 14: Data Table on Global – Market size and forecast 2021-2026 ($ million)
- Exhibit 15: Chart on Global Market: Year-over-year growth 2021-2026 (%)
- Exhibit 16: Data Table on Global Market: Year-over-year growth 2021-2026 (%)
4 Five Forces Analysis
- 4.1 Five forces summary
- Exhibit 17: Five forces analysis – Comparison between2021 and 2026
- 4.2 Bargaining power of buyers
- Exhibit 18: Chart on Bargaining power of buyers – Impact of key factors 2021 and 2026
- 4.3 Bargaining power of suppliers
- Exhibit 19: Bargaining power of suppliers – Impact of key factors in 2021 and 2026
- 4.4 Threat of new entrants
- Exhibit 20: Threat of new entrants – Impact of key factors in 2021 and 2026
- 4.5 Threat of substitutes
- Exhibit 21: Threat of substitutes – Impact of key factors in 2021 and 2026
- 4.6 Threat of rivalry
- Exhibit 22: Threat of rivalry – Impact of key factors in 2021 and 2026
- 4.7 Market condition
- Exhibit 23: Chart on Market condition – Five forces 2021 and 2026
5 Market Segmentation by Courses
- 5.1 Market segments
- Exhibit 24: Chart on Courses – Market share 2021-2026 (%)
- Exhibit 25: Data Table on Courses – Market share 2021-2026 (%)
- 5.2 Comparison by Courses
- Exhibit 26: Chart on Comparison by Courses
- Exhibit 27: Data Table on Comparison by Courses
- 5.3 Academic courses – Market size and forecast 2021-2026
- Exhibit 28: Chart on Academic courses – Market size and forecast 2021-2026 ($ million)
- Exhibit 29: Data Table on Academic courses – Market size and forecast 2021-2026 ($ million)
- Exhibit 30: Chart on Academic courses – Year-over-year growth 2021-2026 (%)
- Exhibit 31: Data Table on Academic courses – Year-over-year growth 2021-2026 (%)
- 5.4 Certification courses – Market size and forecast 2021-2026
- Exhibit 32: Chart on Certification courses – Market size and forecast 2021-2026 ($ million)
- Exhibit 33: Data Table on Certification courses – Market size and forecast 2021-2026 ($ million)
- Exhibit 34: Chart on Certification courses – Year-over-year growth 2021-2026 (%)
- Exhibit 35: Data Table on Certification courses – Year-over-year growth 2021-2026 (%)
- 5.5 Market opportunity by Courses
- Exhibit 36: Market opportunity by Courses ($ million)
6 Customer Landscape
- 6.1 Customer landscape overview
- Exhibit 37: Analysis of price sensitivity, lifecycle, customer purchase basket, adoption rates, and purchase criteria
7 Geographic Landscape
- 7.1 Geographic segmentation
- Exhibit 38: Chart on Market share by geography 2021-2026 (%)
- Exhibit 39: Data Table on Market share by geography 2021-2026 (%)
- 7.2 Geographic comparison
- Exhibit 40: Chart on Geographic comparison
- Exhibit 41: Data Table on Geographic comparison
- 7.3 Europe – Market size and forecast 2021-2026
- Exhibit 42: Chart on Europe – Market size and forecast 2021-2026 ($ million)
- Exhibit 43: Data Table on Europe – Market size and forecast 2021-2026 ($ million)
- Exhibit 44: Chart on Europe – Year-over-year growth 2021-2026 (%)
- Exhibit 45: Data Table on Europe – Year-over-year growth 2021-2026 (%)
- 7.4 North America – Market size and forecast 2021-2026
- Exhibit 46: Chart on North America – Market size and forecast 2021-2026 ($ million)
- Exhibit 47: Data Table on North America – Market size and forecast 2021-2026 ($ million)
- Exhibit 48: Chart on North America – Year-over-year growth 2021-2026 (%)
- Exhibit 49: Data Table on North America – Year-over-year growth 2021-2026 (%)
- 7.5 APAC – Market size and forecast 2021-2026
- Exhibit 50: Chart on APAC – Market size and forecast 2021-2026 ($ million)
- Exhibit 51: Data Table on APAC – Market size and forecast 2021-2026 ($ million)
- Exhibit 52: Chart on APAC – Year-over-year growth 2021-2026 (%)
- Exhibit 53: Data Table on APAC – Year-over-year growth 2021-2026 (%)
- 7.6 South America – Market size and forecast 2021-2026
- Exhibit 54: Chart on South America – Market size and forecast 2021-2026 ($ million)
- Exhibit 55: Data Table on South America – Market size and forecast 2021-2026 ($ million)
- Exhibit 56: Chart on South America – Year-over-year growth 2021-2026 (%)
- Exhibit 57: Data Table on South America – Year-over-year growth 2021-2026 (%)
- 7.7 Middle East and Africa – Market size and forecast 2021-2026
- Exhibit 58: Chart on Middle East and Africa – Market size and forecast 2021-2026 ($ million)
- Exhibit 59: Data Table on Middle East and Africa – Market size and forecast 2021-2026 ($ million)
- Exhibit 60: Chart on Middle East and Africa – Year-over-year growth 2021-2026 (%)
- Exhibit 61: Data Table on Middle East and Africa – Year-over-year growth 2021-2026 (%)
- 7.8 US – Market size and forecast 2021-2026
- Exhibit 62: Chart on US – Market size and forecast 2021-2026 ($ million)
- Exhibit 63: Data Table on US – Market size and forecast 2021-2026 ($ million)
- Exhibit 64: Chart on US – Year-over-year growth 2021-2026 (%)
- Exhibit 65: Data Table on US – Year-over-year growth 2021-2026 (%)
- 7.9 Germany – Market size and forecast 2021-2026
- Exhibit 66: Chart on Germany – Market size and forecast 2021-2026 ($ million)
- Exhibit 67: Data Table on Germany – Market size and forecast 2021-2026 ($ million)
- Exhibit 68: Chart on Germany – Year-over-year growth 2021-2026 (%)
- Exhibit 69: Data Table on Germany – Year-over-year growth 2021-2026 (%)
- 7.10 UK – Market size and forecast 2021-2026
- Exhibit 70: Chart on UK – Market size and forecast 2021-2026 ($ million)
- Exhibit 71: Data Table on UK – Market size and forecast 2021-2026 ($ million)
- Exhibit 72: Chart on UK – Year-over-year growth 2021-2026 (%)
- Exhibit 73: Data Table on UK – Year-over-year growth 2021-2026 (%)
- 7.11 Canada – Market size and forecast 2021-2026
- Exhibit 74: Chart on Canada – Market size and forecast 2021-2026 ($ million)
- Exhibit 75: Data Table on Canada – Market size and forecast 2021-2026 ($ million)
- Exhibit 76: Chart on Canada – Year-over-year growth 2021-2026 (%)
- Exhibit 77: Data Table on Canada – Year-over-year growth 2021-2026 (%)
- 7.12 China – Market size and forecast 2021-2026
- Exhibit 78: Chart on China – Market size and forecast 2021-2026 ($ million)
- Exhibit 79: Data Table on China – Market size and forecast 2021-2026 ($ million)
- Exhibit 80: Chart on China – Year-over-year growth 2021-2026 (%)
- Exhibit 81: Data Table on China – Year-over-year growth 2021-2026 (%)
- 7.13 Market opportunity by geography
- Exhibit 82: Market opportunity by geography ($ million)
8 Drivers, Challenges, and Trends
- 8.1 Market drivers
- 8.2 Market challenges
- 8.3 Impact of drivers and challenges
- Exhibit 83: Impact of drivers and challenges in 2021 and 2026
- 8.4 Market trends
9 Vendor Landscape
- 9.1 Overview
- 9.2 Vendor landscape
- Exhibit 84: Overview on Criticality of inputs and Factors of differentiation
- 9.3 Landscape disruption
- Exhibit 85: Overview on factors of disruption
- 9.4 Industry risks
- Exhibit 86: Impact of key risks on business
10 Vendor Analysis
- 10.1 Vendors covered
- Exhibit 87: Vendors covered
- 10.2 Market positioning of vendors
- Exhibit 88: Matrix on vendor position and classification
- 10.3 Alibaba Group Holding Ltd.
- Exhibit 89: Alibaba Group Holding Ltd. – Overview
- Exhibit 90: Alibaba Group Holding Ltd. – Business segments
- Exhibit 91: Alibaba Group Holding Ltd. – Key offerings
- Exhibit 92: Alibaba Group Holding Ltd. – Segment focus
- 10.4 Alphabet Inc.
- Exhibit 93: Alphabet Inc. – Overview
- Exhibit 94: Alphabet Inc. – Business segments
- Exhibit 95: Alphabet Inc. – Key news
- Exhibit 96: Alphabet Inc. – Key offerings
- Exhibit 97: Alphabet Inc. – Segment focus
- 10.5 Amazon.com Inc.
- Exhibit 98: Amazon.com Inc. – Overview
- Exhibit 99: Amazon.com Inc. – Business segments
- Exhibit 100: Amazon.com Inc. – Key news
- Exhibit 101: Amazon.com Inc. – Key offerings
- Exhibit 102: Amazon.com Inc. – Segment focus
- 10.6 Coursera Inc.
- Exhibit 103: Coursera Inc. – Overview
- Exhibit 104: Coursera Inc. – Business segments
- Exhibit 105: Coursera Inc. – Key news
- Exhibit 106: Coursera Inc. – Key offerings
- Exhibit 107: Coursera Inc. – Segment focus
- 10.7 Digital Marketing Institute Ltd.
- Exhibit 108: Digital Marketing Institute Ltd. – Overview
- Exhibit 109: Digital Marketing Institute Ltd. – Product / Service
- Exhibit 110: Digital Marketing Institute Ltd. – Key offerings
- 10.8 Engaging Ideas Pvt. Ltd.
- Exhibit 111: Engaging Ideas Pvt. Ltd. – Overview
- Exhibit 112: Engaging Ideas Pvt. Ltd. – Product / Service
- Exhibit 113: Engaging Ideas Pvt. Ltd. – Key offerings
- 10.9 Manipal Academy of Higher Education
- Exhibit 114: Manipal Academy of Higher Education – Overview
- Exhibit 115: Manipal Academy of Higher Education – Product / Service
- Exhibit 116: Manipal Academy of Higher Education – Key offerings
- 10.10 Meta Platforms Inc.
- Exhibit 117: Meta Platforms Inc. – Overview
- Exhibit 118: Meta Platforms Inc. – Business segments
- Exhibit 119: Meta Platforms Inc. – Key news
- Exhibit 120: Meta Platforms Inc. – Key offerings
- Exhibit 121: Meta Platforms Inc. – Segment focus
- 10.11 NIIT Ltd.
- Exhibit 122: NIIT Ltd. – Overview
- Exhibit 123: NIIT Ltd. – Business segments
- Exhibit 124: NIIT Ltd. – Key news
- Exhibit 125: NIIT Ltd. – Key offerings
- Exhibit 126: NIIT Ltd. – Segment focus
- 10.12 Simplilearn Solutions Pvt. Ltd.
- Exhibit 127: Simplilearn Solutions Pvt. Ltd. – Overview
- Exhibit 128: Simplilearn Solutions Pvt. Ltd. – Product / Service
- Exhibit 129: Simplilearn Solutions Pvt. Ltd. – Key offerings
11 Appendix
- 11.1 Scope of the report
- 11.2 Inclusions and exclusions checklist
- Exhibit 130: Inclusions checklist
- Exhibit 131: Exclusions checklist
- 11.3 Currency conversion rates for US$
- Exhibit 132: Currency conversion rates for US$
- 11.4 Research methodology
- Exhibit 133: Research methodology
- Exhibit 134: Validation techniques employed for market sizing
- Exhibit 135: Information sources
- 11.5 List of abbreviations
- Exhibit 136: List of abbreviations
About Us
Technavio is a leading global technology research and advisory company. Their research and analysis focus on emerging market trends and provide actionable insights to help businesses identify market opportunities and develop effective strategies to optimize their market positions. With over 500 specialized analysts, Technavio’s report library consists of more than 17,000 reports and counting, covering 800 technologies, spanning across 50 countries. Their client base consists of enterprises of all sizes, including more than 100 Fortune 500 companies. This growing client base relies on Technavio’s comprehensive coverage, extensive research, and actionable market insights to identify opportunities in existing and potential markets and assess their competitive positions within changing market scenarios.
Contact
Technavio Research
Jesse Maida
Media & Marketing Executive
US: +1 844 364 1100
UK: +44 203 893 3200
Email: media@technavio.com
Website: www.technavio.com/
![]()
![]() View original content to download multimedia:https://www.prnewswire.com/news-releases/digital-marketing-courses-market-recorded-11-67-growth-between-2021-and-2022-insights-on-top-countries-such-as-the-uk-among-others–technavio-301736022.html
View original content to download multimedia:https://www.prnewswire.com/news-releases/digital-marketing-courses-market-recorded-11-67-growth-between-2021-and-2022-insights-on-top-countries-such-as-the-uk-among-others–technavio-301736022.html
SOURCE Technavio

Source link
The content is by PR Newswire. Headlines of Today Media is not responsible for the content provided or any links related to this content. Headlines of Today Media is not responsible for the correctness, topicality or the quality of the content.