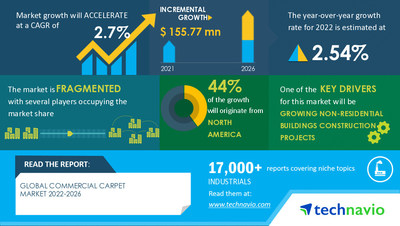
NEW YORK, Aug. 19, 2022 /PRNewswire/ — The commercial carpet market size is expected to grow by USD 155.77 mn from 2021 to 2026. In addition, the growth momentum of the market will accelerate at a CAGR of 2.7% during the forecast period. The growing non-residential building construction projects are driving the commercial carpet market growth. However, factors such as the easy availability of substitutes may challenge the market growth.

The report offers an up-to-date analysis of the current market scenario, the latest trends and drivers, and the overall market environment. Request Latest FREE PDF sample report
The commercial carpet market report covers the following areas:
- Commercial Carpet Market Size
- Commercial Carpet Market Trends
- Commercial Carpet Market Industry Analysis
Armstrong Flooring Inc., Balta Group NV, Beaulieu International Group, Berkshire Hathaway Inc., Burmatex Ltd., Ege Carpets AS, Engineered Floors LLC, Forbo Holding AG, Headlam Group Plc, Heckmondwike FB Ltd., Interface Inc., Koch Industries Inc., Mannington Mills Inc., Milliken and Co., Mohawk Industries Inc., Newhey Carpets Ltd., Remland Carpets Online Ltd., Tarkett Group, Thomas Witter Carpets Ltd., Toli Floor Corp., and Victoria Plc are among some of the major market participants. The key offerings of a few of these vendors are listed below:
- Berkshire Hathaway Inc. – The company offers commercial carpet products such as commercial carpet tiles and broadlooms tiles.
- Engineered Floors LLC – The company offers commercial carpet product brands such as WOOD LUX, NEW STANDARD PLUS, and NO LIMITS III.
- Forbo Holding AG – The company offers commercial carpet products such as tufted (Tessera), flocked (Flotex), and Needlefelt carpet tiles.
- Interface Inc. – The company offers commercial carpet product brands such as NY+LON Streets, Simple Abstraction, and Visual Code.
- Mannington Mills Inc. – The company offers commercial carpet products such as modular carpet and broadloom tiles.
This report provides a full list of key vendors, their strategies, and the latest developments. Buy Now to gain access to exclusive information about vendors
The growing non-residential building construction projects are driving the growth of the market. The urban population is growing rapidly, which is expected to fuel the demand for new commercial buildings during the forecast period. North America is a major producer and consumer of commercial carpets, with education, public, retail, hospitality, and government buildings being key end-users. Commercial construction projects are rising at a high growth rate in APAC. Such factors will support the commercial carpet market growth during the forecast period.
The easy availability of substitutes is challenging the growth of the market. There is a wide range of flooring materials, such as ceramic, cork, laminate, linoleum, wood, stone, and vinyl, in the global commercial flooring market. Commercial builders in APAC prefer ceramics and other hardwood flooring materials. Moreover, manufacturers of flooring materials provide offerings that are differentiated in terms of price, weight, and colors. These factors will hamper the commercial carpet market growth during the forecast period.
- Product
- Carpet Tiles
- Broadlooms
- Geography
- North America
- Europe
- APAC
- South America
- Middle East And Africa
- CAGR of the market during the forecast period 2022-2026
- Detailed information on factors that will assist commercial carpet market growth during the next five years
- Estimation of the commercial carpet market size and its contribution to the parent market
- Predictions on upcoming trends and changes in consumer behavior
- The growth of the commercial carpet market
- Analysis of the market’s competitive landscape and detailed information on vendors
- Comprehensive details of factors that will challenge the growth of commercial carpet market vendors
Global Safes and Vaults Market by Product, End-user, and Geography – Forecast and Analysis 2022-2026
Flame Detectors Market by Product and Geography – Forecast and Analysis 2022-2026
|
Commercial Carpet Market Scope |
|
|
Report Coverage |
Details |
|
Page number |
120 |
|
Base year |
2021 |
|
Forecast period |
2022-2026 |
|
Growth momentum & CAGR |
Accelerate at a CAGR of 2.7% |
|
Market growth 2022-2026 |
USD 155.77 million |
|
Market structure |
Fragmented |
|
YoY growth (%) |
2.54 |
|
Regional analysis |
North America, Europe, APAC, South America, and Middle East and Africa |
|
Performing market contribution |
North America at 44% |
|
Key consumer countries |
US, United Arab Emirates, China, Germany, and UK |
|
Competitive landscape |
Leading companies, competitive strategies, consumer engagement scope |
|
Companies profiled |
Armstrong Flooring Inc., Balta Group NV, Beaulieu International Group, Berkshire Hathaway Inc., Burmatex Ltd., Ege Carpets AS, Engineered Floors LLC, Forbo Holding AG, Headlam Group Plc, Heckmondwike FB Ltd., Interface Inc., Koch Industries Inc., Mannington Mills Inc., Milliken and Co., Mohawk Industries Inc., Newhey Carpets Ltd., Remland Carpets Online Ltd., Tarkett Group, Thomas Witter Carpets Ltd., Toli Floor Corp., and Victoria Plc |
|
Market Dynamics |
Parent market analysis, market growth inducers and obstacles, fast-growing and slow-growing segment analysis, COVID 19 impact and future consumer dynamics, and market condition analysis for the forecast period. |
|
Customization purview |
If our report has not included the data that you are looking for, you can reach out to our analysts and get segments customized. |
Browse Industrials Market Reports
1 Executive Summary
- 1.1 Market overview
- Exhibit 01: Executive Summary – Chart on Market Overview
- Exhibit 02: Executive Summary – Data Table on Market Overview
- Exhibit 03: Executive Summary – Chart on Global Market Characteristics
- Exhibit 04: Executive Summary – Chart on Market by Geography
- Exhibit 05: Executive Summary – Chart on Market Segmentation by Product
- Exhibit 06: Executive Summary – Chart on Incremental Growth
- Exhibit 07: Executive Summary – Data Table on Incremental Growth
- Exhibit 08: Executive Summary – Chart on Vendor Market Positioning
2 Market Landscape
- 2.1 Market ecosystem
- Exhibit 09: Parent market
- Exhibit 10: Market Characteristics
3 Market Sizing
- 3.1 Market definition
- Exhibit 11: Offerings of vendors included in the market definition
- 3.2 Market segment analysis
- Exhibit 12: Market segments
- 3.3 Market size 2021
- 3.4 Market outlook: Forecast for 2021-2026
- Exhibit 13: Chart on Global – Market size and forecast 2021-2026 ($ million)
- Exhibit 14: Data Table on Global – Market size and forecast 2021-2026 ($ million)
- Exhibit 15: Chart on Global Market: Year-over-year growth 2021-2026 (%)
- Exhibit 16: Data Table on Global Market: Year-over-year growth 2021-2026 (%)
4 Five Forces Analysis
- 4.1 Five forces summary
- Exhibit 17: Five forces analysis – Comparison between 2021 and 2026
- 4.2 Bargaining power of buyers
- Exhibit 18: Chart on Bargaining power of buyers – Impact of key factors 2021 and 2026
- 4.3 Bargaining power of suppliers
- Exhibit 19: Bargaining power of suppliers – Impact of key factors in 2021 and 2026
- 4.4 Threat of new entrants
- Exhibit 20: Threat of new entrants – Impact of key factors in 2021 and 2026
- 4.5 Threat of substitutes
- Exhibit 21: Threat of substitutes – Impact of key factors in 2021 and 2026
- 4.6 Threat of rivalry
- Exhibit 22: Threat of rivalry – Impact of key factors in 2021 and 2026
- 4.7 Market condition
- Exhibit 23: Chart on Market condition – Five forces 2021 and 2026
5 Market Segmentation by Product
- 5.1 Market segments
- Exhibit 24: Chart on Product – Market share 2021-2026 (%)
- Exhibit 25: Data Table on Product – Market share 2021-2026 (%)
- 5.2 Comparison by Product
- Exhibit 26: Chart on Comparison by Product
- Exhibit 27: Data Table on Comparison by Product
- 5.3 Carpet tiles – Market size and forecast 2021-2026
- Exhibit 28: Chart on Carpet tiles – Market size and forecast 2021-2026 ($ million)
- Exhibit 29: Data Table on Carpet tiles – Market size and forecast 2021-2026 ($ million)
- Exhibit 30: Chart on Carpet tiles – Year-over-year growth 2021-2026 (%)
- Exhibit 31: Data Table on Carpet tiles – Year-over-year growth 2021-2026 (%)
- 5.4 Broadlooms – Market size and forecast 2021-2026
- Exhibit 32: Chart on Broadlooms – Market size and forecast 2021-2026 ($ million)
- Exhibit 33: Data Table on Broadlooms – Market size and forecast 2021-2026 ($ million)
- Exhibit 34: Chart on Broadlooms – Year-over-year growth 2021-2026 (%)
- Exhibit 35: Data Table on Broadlooms – Year-over-year growth 2021-2026 (%)
- 5.5 Market opportunity by Product
- Exhibit 36: Market opportunity by Product ($ million)
6 Customer Landscape
- 6.1 Customer landscape overview
- Exhibit 37: Analysis of price sensitivity, lifecycle, customer purchase basket, adoption rates, and purchase criteria
7 Geographic Landscape
- 7.1 Geographic segmentation
- Exhibit 38: Chart on Market share by geography 2021-2026 (%)
- Exhibit 39: Data Table on Market share by geography 2021-2026 (%)
- 7.2 Geographic comparison
- Exhibit 40: Chart on Geographic comparison
- Exhibit 41: Data Table on Geographic comparison
- 7.3 North America – Market size and forecast 2021-2026
- Exhibit 42: Chart on North America – Market size and forecast 2021-2026 ($ million)
- Exhibit 43: Data Table on North America – Market size and forecast 2021-2026 ($ million)
- Exhibit 44: Chart on North America – Year-over-year growth 2021-2026 (%)
- Exhibit 45: Data Table on North America – Year-over-year growth 2021-2026 (%)
- 7.4 Europe – Market size and forecast 2021-2026
- Exhibit 46: Chart on Europe – Market size and forecast 2021-2026 ($ million)
- Exhibit 47: Data Table on Europe – Market size and forecast 2021-2026 ($ million)
- Exhibit 48: Chart on Europe – Year-over-year growth 2021-2026 (%)
- Exhibit 49: Data Table on Europe – Year-over-year growth 2021-2026 (%)
- 7.5 APAC – Market size and forecast 2021-2026
- Exhibit 50: Chart on APAC – Market size and forecast 2021-2026 ($ million)
- Exhibit 51: Data Table on APAC – Market size and forecast 2021-2026 ($ million)
- Exhibit 52: Chart on APAC – Year-over-year growth 2021-2026 (%)
- Exhibit 53: Data Table on APAC – Year-over-year growth 2021-2026 (%)
- 7.6 South America – Market size and forecast 2021-2026
- Exhibit 54: Chart on South America – Market size and forecast 2021-2026 ($ million)
- Exhibit 55: Data Table on South America – Market size and forecast 2021-2026 ($ million)
- Exhibit 56: Chart on South America – Year-over-year growth 2021-2026 (%)
- Exhibit 57: Data Table on South America – Year-over-year growth 2021-2026 (%)
- 7.7 Middle East and Africa – Market size and forecast 2021-2026
- Exhibit 58: Chart on Middle East and Africa – Market size and forecast 2021-2026 ($ million)
- Exhibit 59: Data Table on Middle East and Africa – Market size and forecast 2021-2026 ($ million)
- Exhibit 60: Chart on Middle East and Africa – Year-over-year growth 2021-2026 (%)
- Exhibit 61: Data Table on Middle East and Africa – Year-over-year growth 2021-2026 (%)
- 7.8 US – Market size and forecast 2021-2026
- Exhibit 62: Chart on US – Market size and forecast 2021-2026 ($ million)
- Exhibit 63: Data Table on US – Market size and forecast 2021-2026 ($ million)
- Exhibit 64: Chart on US – Year-over-year growth 2021-2026 (%)
- Exhibit 65: Data Table on US – Year-over-year growth 2021-2026 (%)
- 7.9 China – Market size and forecast 2021-2026
- Exhibit 66: Chart on China – Market size and forecast 2021-2026 ($ million)
- Exhibit 67: Data Table on China – Market size and forecast 2021-2026 ($ million)
- Exhibit 68: Chart on China – Year-over-year growth 2021-2026 (%)
- Exhibit 69: Data Table on China – Year-over-year growth 2021-2026 (%)
- 7.10 Germany – Market size and forecast 2021-2026
- Exhibit 70: Chart on Germany – Market size and forecast 2021-2026 ($ million)
- Exhibit 71: Data Table on Germany – Market size and forecast 2021-2026 ($ million)
- Exhibit 72: Chart on Germany – Year-over-year growth 2021-2026 (%)
- Exhibit 73: Data Table on Germany – Year-over-year growth 2021-2026 (%)
- 7.11 UK – Market size and forecast 2021-2026
- Exhibit 74: Chart on UK – Market size and forecast 2021-2026 ($ million)
- Exhibit 75: Data Table on UK – Market size and forecast 2021-2026 ($ million)
- Exhibit 76: Chart on UK – Year-over-year growth 2021-2026 (%)
- Exhibit 77: Data Table on UK – Year-over-year growth 2021-2026 (%)
- 7.12 United Arab Emirates – Market size and forecast 2021-2026
- Exhibit 78: Chart on United Arab Emirates – Market size and forecast 2021-2026 ($ million)
- Exhibit 79: Data Table on United Arab Emirates – Market size and forecast 2021-2026 ($ million)
- Exhibit 80: Chart on United Arab Emirates – Year-over-year growth 2021-2026 (%)
- Exhibit 81: Data Table on United Arab Emirates – Year-over-year growth 2021-2026 (%)
- 7.13 Market opportunity by geography
- Exhibit 82: Market opportunity by geography ($ million)
8 Drivers, Challenges, and Trends
- 8.1 Market drivers
- 8.2 Market challenges
- 8.3 Impact of drivers and challenges
- Exhibit 83: Impact of drivers and challenges in 2021 and 2026
- 8.4 Market trends
9 Vendor Landscape
- 9.1 Overview
- 9.2 Vendor landscape
- Exhibit 84: Overview on Criticality of inputs and Factors of differentiation
- 9.3 Landscape disruption
- Exhibit 85: Overview on factors of disruption
- 9.4 Industry risks
- Exhibit 86: Impact of key risks on business
10 Vendor Analysis
- 10.1 Vendors covered
- Exhibit 87: Vendors covered
- 10.2 Market positioning of vendors
- Exhibit 88: Matrix on vendor position and classification
- 10.3 Berkshire Hathaway Inc.
- Exhibit 89: Berkshire Hathaway Inc. – Overview
- Exhibit 90: Berkshire Hathaway Inc. – Business segments
- Exhibit 91: Berkshire Hathaway Inc. – Key offerings
- Exhibit 92: Berkshire Hathaway Inc. – Segment focus
- 10.4 Engineered Floors LLC
- Exhibit 93: Engineered Floors LLC – Overview
- Exhibit 94: Engineered Floors LLC – Product / Service
- Exhibit 95: Engineered Floors LLC – Key offerings
- 10.5 Forbo Holding AG
- Exhibit 96: Forbo Holding AG – Overview
- Exhibit 97: Forbo Holding AG – Business segments
- Exhibit 98: Forbo Holding AG – Key offerings
- Exhibit 99: Forbo Holding AG – Segment focus
- 10.6 Interface Inc.
- Exhibit 100: Interface Inc. – Overview
- Exhibit 101: Interface Inc. – Product / Service
- Exhibit 102: Interface Inc. – Key offerings
- 10.7 Mannington Mills Inc.
- Exhibit 103: Mannington Mills Inc. – Overview
- Exhibit 104: Mannington Mills Inc. – Product / Service
- Exhibit 105: Mannington Mills Inc. – Key offerings
- 10.8 Milliken and Co.
- Exhibit 106: Milliken and Co. – Overview
- Exhibit 107: Milliken and Co. – Product / Service
- Exhibit 108: Milliken and Co. – Key news
- Exhibit 109: Milliken and Co. – Key offerings
- 10.9 Mohawk Industries Inc.
- Exhibit 110: Mohawk Industries Inc. – Overview
- Exhibit 111: Mohawk Industries Inc. – Business segments
- Exhibit 112: Mohawk Industries Inc. – Key offerings
- Exhibit 113: Mohawk Industries Inc. – Segment focus
- 10.10 Tarkett Group
- Exhibit 114: Tarkett Group – Overview
- Exhibit 115: Tarkett Group – Business segments
- Exhibit 116: Tarkett Group – Key offerings
- Exhibit 117: Tarkett Group – Segment focus
- 10.11 Toli Floor Corp.
- Exhibit 118: Toli Floor Corp. – Overview
- Exhibit 119: Toli Floor Corp. – Product / Service
- Exhibit 120: Toli Floor Corp. – Key offerings
- 10.12 Victoria Plc
- Exhibit 121: Victoria Plc – Overview
- Exhibit 122: Victoria Plc – Business segments
- Exhibit 123: Victoria Plc – Key offerings
- Exhibit 124: Victoria Plc – Segment focus
11 Appendix
- 11.1 Scope of the report
- 11.2 Inclusions and exclusions checklist
- Exhibit 125: Inclusions checklist
- Exhibit 126: Exclusions checklist
- 11.3 Currency conversion rates for US$
- Exhibit 127: Currency conversion rates for US$
- 11.4 Research methodology
- Exhibit 128: Research methodology
- Exhibit 129: Validation techniques employed for market sizing
- Exhibit 130: Information sources
- 11.5 List of abbreviations
- Exhibit 131: List of abbreviations
Technavio is a leading global technology research and advisory company. Their research and analysis focus on emerging market trends and provide actionable insights to help businesses identify market opportunities and develop effective strategies to optimize their market positions. With over 500 specialized analysts, Technavio’s report library consists of more than 17,000 reports and counting, covering 800 technologies, spanning across 50 countries. Their client base consists of enterprises of all sizes, including more than 100 Fortune 500 companies. This growing client base relies on Technavio’s comprehensive coverage, extensive research, and actionable market insights to identify opportunities in existing and potential markets and assess their competitive positions within changing market scenarios.
Contact
Technavio Research
Jesse Maida
Media & Marketing Executive
US: +1 844 364 1100
UK: +44 203 893 3200
Email: media@technavio.com
Website: www.technavio.com/
![]()
![]() View original content to download multimedia:https://www.prnewswire.com/news-releases/commercial-carpet-market-size-to-grow-by-usd-155-77-million-berkshire-hathaway-inc-and-engineered-floors-llc-among-key-vendors—technavio-301607625.html
View original content to download multimedia:https://www.prnewswire.com/news-releases/commercial-carpet-market-size-to-grow-by-usd-155-77-million-berkshire-hathaway-inc-and-engineered-floors-llc-among-key-vendors—technavio-301607625.html
SOURCE Technavio

Source link
The content is by PR Newswire. Headlines of Today Media is not responsible for the content provided or any links related to this content. Headlines of Today Media is not responsible for the correctness, topicality or the quality of the content.