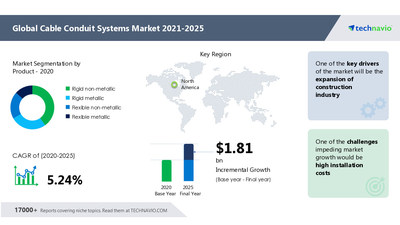
NEW YORK, June 16, 2022 /PRNewswire/ — The expansion of the construction industry is notably driving the Cable Conduit Systems Market growth. The cable conduit market has registered a steady growth predominantly owing to the continued expansion of the construction industry, particularly in emerging countries. The construction industry in emerging markets is expected to experience a ten times higher growth rate with respect to the global market. The high demand for better infrastructure provides opportunities for cable conduit systems. The Indian construction market is projected to grow faster than China, largely driven by urbanization and infrastructural investments. The momentum in the construction industry is propelling the demand for cable conduit systems across industrial, commercial, and residential sectors.

Look out for more information on market dynamics scenario, demand & supply forces, product offerings, financial information, and SWOT analysis. All at affordable Plans
The market value is set to grow by USD 1.81 billion, progressing at a CAGR of 5.24% from 2020 to 2025, as per the latest report by Technavio.
Cable Conduit Systems Market: Challenge
The major challenge impeding the cable conduit systems market growth is the high installation costs. Cable conduit systems cost higher than all other wiring methods, which limits their growth prospect to an extent. The installation is complex and requires highly skilled labor when compared to other wiring systems, which increases the labor cost. Additionally, the volatility in the prices of raw materials such as plastic, steel, and aluminum is also pushing up the costs. Metal conduits are costly due to the high prices of steel and aluminum. The fluctuations in the raw material prices disrupt the pricing strategy of the cable conduit system manufacturers. With the intense competition in the market and little product differentiation, vendors are required to maintain competitive pricing. This is acting as a deterrent to market growth, owing to the price sensitivity of customers.
|
Cable Conduit Systems Market Scope |
|
|
Report Coverage |
Details |
|
Page number |
120 |
|
Base year |
2020 |
|
Forecast period |
2021-2025 |
|
Growth momentum & CAGR |
Accelerate at a CAGR of 5.24% |
|
Market growth 2021-2025 |
$ 1.81 billion |
|
Market structure |
Fragmented |
|
YoY growth (%) |
4.76 |
|
Regional analysis |
North America, APAC, Europe, MEA, South America, North America, APAC, Europe, MEA, and South America |
|
Performing market contribution |
North America at 32% |
|
Key consumer countries |
US, China, Germany, Japan, and UK |
|
Competitive landscape |
Leading companies, competitive strategies, consumer engagement scope |
|
Companies profiled |
ABB Ltd., Aliaxis Group SA, Atkore International Group Inc., Delphi Technologies Plc, Dura-Line, Eaton Corporation Plc, Hubbell Inc., igus GmbH, Legrand SA, and Schneider Electric SE |
|
Market Dynamics |
Parent market analysis, Market growth inducers and obstacles, Fast-growing and slow-growing segment analysis, COVID 19 impact and future consumer dynamics, market condition analysis for forecast period, |
|
Customization preview |
If our report has not included the data that you are looking for, you can reach out to our analysts and get segments customized. |
The Cable Conduit Systems Market Covers the Following Areas:
Cable Conduit Systems Market Sizing
Cable Conduit Systems Market Forecast
Cable Conduit Systems Market Analysis
Cable Conduit Systems Market: Segmentation Analysis & Forecast
The market is segmented by product (rigid non-metallic, rigid metallic, flexible non-metallic, and flexible metallic), end-user (commercial, manufacturing, IT and telecommunication, healthcare, and others). The cable conduit systems market share growth by the rigid non-metallic segment will be significant during the forecast period. The non-metallic conduits are waterproof, corrosion-resistant, non-conductive, and resistant to sunlight and can be used for outdoor applications. The high demand for rigid non-metallic conduits owing to low cost, ease of installation, and the wide variety of applications will drive the market growth through this segment in the coming years.
Cable Conduit Systems Market: Regional Analysis & Forecast
The market is segmented by Geography (North America, APAC, Europe, MEA, South America). 32% of the market’s growth will originate from North America during the forecast period. The US is the key market for cable conduit systems market in North America. Market growth in this region will be faster than the growth of the market in Europe and South America. The growth momentum is driven by technological advances and product innovations to provide advanced cable conduit systems that offer increased protection and efficiency. This will facilitate the cable conduit systems market growth in North America over the forecast period.
Cable Conduit Systems Market: Companies Mentioned
- ABB Ltd.
- Aliaxis Group SA
- Atkore International Group Inc.
- Delphi Technologies Plc
- Dura-Line
- Eaton Corporation Plc
- Hubbell Inc.
- igus GmbH
- Legrand SA
- Schneider Electric SE
Related Reports:
Coaxial Cables Market by End-user and Geography – Forecast and Analysis 2021-2025: The coaxial cables market share is expected to increase by USD 2.47 billion from 2020 to 2025, and the market’s growth momentum will accelerate at a CAGR of 4.24%. To get more exclusive research insights: Download Our Sample Report
Cable Assembly Market by Application, Product, and Geography – Forecast and Analysis 2021-2025: The cable assembly market share is expected to increase by USD 67.87 billion from 2020 to 2025, and the market’s growth momentum will accelerate at a CAGR of 6.61%. To get more exclusive research insights: Download Our Sample Report
Key Topics Covered:
1 Executive Summary
2 Market Landscape
- 2.1 Market ecosystem
- Exhibit 01: Parent market
- Exhibit 02: Market characteristics
- 2.2 Value chain analysis
- Exhibit 03: Value Chain Analysis: Electrical Components and equipment
3 Market Sizing
- 3.1 Market definition
- Exhibit 04: Offerings of vendors included in the market definition
- 3.2 Market segment analysis
- Exhibit 05: Market segments
- 3.3 Market size 2020
- 3.4 Market outlook: Forecast for 2020 – 2025
- Exhibit 06: Global – Market size and forecast 2020 – 2025 ($ million)
- Exhibit 07: Global market: Year-over-year growth 2020 – 2025 (%)
4 Five Forces Analysis
- 4.1 Five Forces Summary
- Exhibit 08: Five forces analysis 2020 & 2025
- 4.2 Bargaining power of buyers
- Exhibit 09: Bargaining power of buyers
- 4.3 Bargaining power of suppliers
- Exhibit 10: Bargaining power of suppliers
- 4.4 Threat of new entrants
- Exhibit 11: Threat of new entrants
- 4.5 Threat of substitutes
- Exhibit 12: Threat of substitutes
- 4.6 Threat of rivalry
- Exhibit 13: Threat of rivalry
- 4.7 Market condition
- Exhibit 14: Market condition – Five forces 2020
5 Market Segmentation by Product
- 5.1 Market segments
- Exhibit 15: Product – Market share 2020-2025 (%)
- 5.2 Comparison by Product
- Exhibit 16: Comparison by Product
- 5.3 Rigid non-metallic – Market size and forecast 2020-2025
- Exhibit 17: Rigid non-metallic – Market size and forecast 2020-2025 ($ million)
- Exhibit 18: Rigid non-metallic – Year-over-year growth 2020-2025 (%)
- 5.4 Rigid metallic – Market size and forecast 2020-2025
- Exhibit 19: Rigid metallic – Market size and forecast 2020-2025 ($ million)
- Exhibit 20: Rigid metallic – Year-over-year growth 2020-2025 (%)
- 5.5 Flexible non-metallic – Market size and forecast 2020-2025
- Exhibit 21: Flexible non-metallic – Market size and forecast 2020-2025 ($ million)
- Exhibit 22: Flexible non-metallic – Year-over-year growth 2020-2025 (%)
- 5.6 Flexible metallic – Market size and forecast 2020-2025
- Exhibit 23: Flexible metallic – Market size and forecast 2020-2025 ($ million)
- Exhibit 24: Flexible metallic – Year-over-year growth 2020-2025 (%)
- 5.7 Market opportunity by Product
- Exhibit 25: Market opportunity by Product
6 Market Segmentation by End-user
- 6.1 Market segments
- 6.2 Comparison by End-user
- 6.3 Commercial – Market size and forecast 2020-2025
- Exhibit 28: Commercial – Market size and forecast 2020-2025 ($ million)
- Exhibit 29: Commercial – Year-over-year growth 2020-2025 (%)
- 6.4 Manufacturing – Market size and forecast 2020-2025
- Exhibit 30: Manufacturing – Market size and forecast 2020-2025 ($ million)
- Exhibit 31: Manufacturing – Year-over-year growth 2020-2025 (%)
- 6.5 IT and telecommunication – Market size and forecast 2020-2025
- Exhibit 32: IT and telecommunication – Market size and forecast 2020-2025 ($ million)
- Exhibit 33: IT and telecommunication – Year-over-year growth 2020-2025 (%)
- 6.6 Healthcare – Market size and forecast 2020-2025
- Exhibit 34: Healthcare – Market size and forecast 2020-2025 ($ million)
- Exhibit 35: Healthcare – Year-over-year growth 2020-2025 (%)
- 6.7 Others – Market size and forecast 2020-2025
- Exhibit 36: Others – Market size and forecast 2020-2025 ($ million)
- Exhibit 37: Others – Year-over-year growth 2020-2025 (%)
- 6.8 Market opportunity by End-user
- Exhibit 38: Market opportunity by End-user
7 Customer landscape
8 Geographic Landscape
- 8.1 Geographic segmentation
- Exhibit 40: Market share by geography 2020-2025 (%)
- 8.2 Geographic comparison
- Exhibit 41: Geographic comparison
- 8.3 North America – Market size and forecast 2020-2025
- Exhibit 42: North America – Market size and forecast 2020-2025 ($ million)
- Exhibit 43: North America – Year-over-year growth 2020-2025 (%)
- 8.4 APAC – Market size and forecast 2020-2025
- Exhibit 44: APAC – Market size and forecast 2020-2025 ($ million)
- Exhibit 45: APAC – Year-over-year growth 2020-2025 (%)
- 8.5 Europe – Market size and forecast 2020-2025
- Exhibit 46: Europe – Market size and forecast 2020-2025 ($ million)
- Exhibit 47: Europe – Year-over-year growth 2020-2025 (%)
- 8.6 MEA – Market size and forecast 2020-2025
- Exhibit 48: MEA – Market size and forecast 2020-2025 ($ million)
- Exhibit 49: MEA – Year-over-year growth 2020-2025 (%)
- 8.7 South America – Market size and forecast 2020-2025
- 8.8 Key leading countries
- Exhibit 52: Key leading countries
- 8.9 Market opportunity by geography
- Exhibit 53: Market opportunity by geography ($ million)
9 Drivers, Challenges, and Trends
- 9.1 Market drivers
- 9.2 Market challenges
- Exhibit 54: Impact of drivers and challenges
- 9.3 Market trends
10 Vendor Landscape
- 10.1 Vendor landscape
- Exhibit 55: Vendor landscape
- 10.2 Landscape disruption
- Exhibit 56: Landscape disruption
- Exhibit 57: Industry risks
- 10.3 Competitive Scenario
11 Vendor Analysis
- 11.1 Vendors covered
- Exhibit 58: Vendors covered
- 11.2 Market positioning of vendors
- Exhibit 59: Market positioning of vendors
- 11.3 ABB Ltd.
- Exhibit 60: ABB Ltd. – Overview
- Exhibit 61: ABB Ltd. – Business segments
- Exhibit 62: ABB Ltd. – Key news
- Exhibit 63: ABB Ltd. – Key offerings
- Exhibit 64: ABB Ltd. – Segment focus
- 11.4 Aliaxis Group SA
- Exhibit 65: Aliaxis Group SA – Overview
- Exhibit 66: Aliaxis Group SA – Product and service
- Exhibit 67: Aliaxis Group SA – Key news
- Exhibit 68: Aliaxis Group SA – Key offerings
- 11.5 Atkore International Group Inc.
- Exhibit 69: Atkore International Group Inc. – Overview
- Exhibit 70: Atkore International Group Inc. – Business segments
- Exhibit 71: Atkore International Group Inc. – Key offerings
- Exhibit 72: Atkore International Group Inc. – Segment focus
- 11.6 Delphi Technologies Plc
- Exhibit 73: Delphi Technologies Plc – Overview
- Exhibit 74: Delphi Technologies Plc – Business segments
- Exhibit 75: Delphi Technologies Plc – Key offerings
- Exhibit 76: Delphi Technologies Plc – Segment focus
- 11.7 Dura-Line
- Exhibit 77: Dura-Line – Overview
- Exhibit 78: Dura-Line – Product and service
- Exhibit 79: Dura-Line – Key offerings
- 11.8 Eaton Corporation Plc
- Exhibit 80: Eaton Corporation Plc – Overview
- Exhibit 81: Eaton Corporation Plc – Business segments
- Exhibit 82: Eaton Corporation Plc – Key news
- Exhibit 83: Eaton Corporation Plc – Key offerings
- Exhibit 84: Eaton Corporation Plc – Segment focus
- 11.9 Hubbell Inc.
- Exhibit 85: Hubbell Inc. – Overview
- Exhibit 86: Hubbell Inc. – Business segments
- Exhibit 87: Hubbell Inc. – Key news
- Exhibit 88: Hubbell Inc. – Key offerings
- Exhibit 89: Hubbell Inc. – Segment focus
- 11.10 igus GmbH
- Exhibit 90: igus GmbH – Overview
- Exhibit 91: igus GmbH – Product and service
- Exhibit 92: igus GmbH – Key news
- Exhibit 93: igus GmbH – Key offerings
- 11.11 Legrand SA
- Exhibit 94: Legrand SA – Overview
- Exhibit 95: Legrand SA – Business segments
- Exhibit 96: Legrand SA – Key offerings
- Exhibit 97: Legrand SA – Segment focus
- 11.12 Schneider Electric SE
- Exhibit 98: Schneider Electric SE – Overview
- Exhibit 99: Schneider Electric SE – Business segments
- Exhibit 100: Schneider Electric SE – Key news
- Exhibit 101: Schneider Electric SE – Key offerings
- Exhibit 102: Schneider Electric SE – Segment focus
12 Appendix
- 12.1 Scope of the report
- 12.2 Currency conversion rates for US$
- Exhibit 103: Currency conversion rates for US$
- 12.3 Research methodology
- Exhibit 104: Research Methodology
- Exhibit 105: Validation techniques employed for market sizing
- Exhibit 106: Information sources
- 12.4 List of abbreviations
- Exhibit 107: List of abbreviations
About Us
Technavio is a leading global technology research and advisory company. Their research and analysis focuses on emerging market trends and provides actionable insights to help businesses identify market opportunities and develop effective strategies to optimize their market positions. With over 500 specialized analysts, Technavio’s report library consists of more than 17,000 reports and counting, covering 800 technologies, spanning across 50 countries. Their client base consists of enterprises of all sizes, including more than 100 Fortune 500 companies. This growing client base relies on Technavio’s comprehensive coverage, extensive research, and actionable market insights to identify opportunities in existing and potential markets and assess their competitive positions within changing market scenarios.
Contact
Technavio Research
Jesse Maida
Media & Marketing Executive
US: +1 844 364 1100
UK: +44 203 893 3200
Email: media@technavio.com
Website: www.technavio.com/
![]()
![]() View original content to download multimedia:https://www.prnewswire.com/news-releases/cable-conduit-systems-market-by-product-end-user-and-geography-global-opportunity-analysis-and-industry-forecast-20212025-301568854.html
View original content to download multimedia:https://www.prnewswire.com/news-releases/cable-conduit-systems-market-by-product-end-user-and-geography-global-opportunity-analysis-and-industry-forecast-20212025-301568854.html
SOURCE Technavio

Source link
The content is by PR Newswire. Headlines of Today Media is not responsible for the content provided or any links related to this content. Headlines of Today Media is not responsible for the correctness, topicality or the quality of the content.