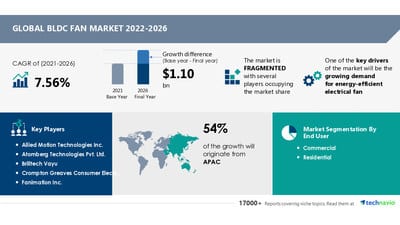
NEW YORK, Aug. 24, 2022 /PRNewswire/ — The BLDC fan market is fragmented. Vendors are deploying growth strategies such as quality, price, service, brand image, distribution, and marketing to compete in the market.

The BLDC fan market size is expected to grow by USD 1.10 bn from 2021 to 2026. In addition, the growth momentum of the market will accelerate at a CAGR of 7.56% during the forecast period, according to Technavio.
Get a comprehensive report summary describing the market size and forecast along with research methodology. The FREE sample report is available in PDF format
BLDC Fan Market 2022-2026:Scope
The BLDC fan market report covers the following areas:
BLDC Fan Market 2022-2026:Vendor Analysis
We provide a detailed analysis of around 25 vendors operating in the BLDC fan market, including Allied Motion Technologies Inc., Atomberg Technologies Pvt. Ltd., Brilltech Vayu, Crompton Greaves Consumer Electricals Ltd., Fanimation Inc., Fantasia Distribution Ltd., Havells India Ltd., Hunter Fan Co., Kichler Lighting LLC, Luminance Brands LLC, MinebeaMitsumi Inc., Minka Lighting Inc., Nidec Corp., OCECO ENERGY Pvt. Ltd., Orient Electric Ltd., Panasonic Holdings Corp., Perfect Enterprises, Usha International Ltd., Versa Drives Pvt Ltd., and Westinghouse Electric Corp. The key offerings of some of these vendors are listed below:
- Allied Motion Technologies Inc. – The company offers BLDC motors such as EnduraMax 95s Series Brushless Motor with Integral Drive.
- Atomberg Technologies Pvt. Ltd. – The company offers BLDC Fan such as Renesa Smart and Studio Plus Series.
- Brilltech Vayu – The company offers BLDC fans such as Classic BLDC Fan, Brushless DC Motor Fan, and Bluetooth BLDC Fan.
- Crompton Greaves Consumer Electricals Ltd. – The company offers BLDC fans such as Energion Charge and Energion Stylus High grade Stylish ceiling fans.
- Fantasia Distribution Ltd. – The company offers BLDC fans such as Aero 56 and Atlanta 30.
BLDC Fan Market 2022-2026:Segmentation
- End-user
- Commercial: The commercial segment will be the largest contributor to the growth of the market during the forecast period. The increasing demand for small and compact DC fans in electrical equipment is expected to drive the growth of the commercial segment. Moreover, the rising demand for cooling systems, increasing demand for advanced and energy-efficient products, and growing trade of fans are also expected to contribute to the global BLDC fan market growth during the forecast period.
- Residential
- Geography
- APAC: This region will account for 54% of the market’s growth during the forecast period. This growth is attributed to factors such as the increased need for cooling solutions for residential applications. However, market growth in this region will be slower than the growth of the market in other regions. China, India, and Japan are the key countries for the brushless direct current fan market in APAC.
- North America
- Europe
- South America
- Middle East And Africa
Learn about the contribution of each segment summarized in concise infographics and thorough descriptions. View a FREE PDF Sample Report
BLDC Fan Market 2022-2026:Key Highlights
- CAGR of the market during the forecast period 2022-2026
- Detailed information on factors that will assist BLDC fan market growth during the next five years
- Estimation of the BLDC fan market size and its contribution to the parent market
- Predictions on upcoming trends and changes in consumer behavior
- The growth of the BLDC fan market
- Analysis of the market’s competitive landscape and detailed information on vendors
- Comprehensive details of factors that will challenge the growth of BLDC fan market vendors
Related Reports
Ventilation and Air Conditioning Market for Indoor Agriculture by Product, Type, and Geography – Forecast and Analysis 2021-2025
Portable Fan Market by Application and Geography – Forecast and Analysis 2022-2026
|
BLDC Fan Market Scope |
|
|
Report Coverage |
Details |
|
Page number |
120 |
|
Base year |
2021 |
|
Forecast period |
2022-2026 |
|
Growth momentum & CAGR |
Accelerate at a CAGR of 7.56% |
|
Market growth 2022-2026 |
USD 1.10 billion |
|
Market structure |
Fragmented |
|
YoY growth (%) |
6.75 |
|
Regional analysis |
APAC, North America, Europe, South America, and Middle East and Africa |
|
Performing market contribution |
APAC at 54% |
|
Key consumer countries |
US, China, India, Japan, and Germany |
|
Competitive landscape |
Leading companies, competitive strategies, consumer engagement scope |
|
Companies profiled |
Allied Motion Technologies Inc., Atomberg Technologies Pvt. Ltd., Brilltech Vayu, Crompton Greaves Consumer Electricals Ltd., Fanimation Inc., Fantasia Distribution Ltd., Havells India Ltd., Hunter Fan Co., Kichler Lighting LLC, Luminance Brands LLC, MinebeaMitsumi Inc., Minka Lighting Inc., Nidec Corp., OCECO ENERGY Pvt. Ltd., Orient Electric Ltd., Panasonic Holdings Corp., Perfect Enterprises, Usha International Ltd., Versa Drives Pvt Ltd., and Westinghouse Electric Corp. |
|
Market Dynamics |
Parent market analysis, market growth inducers and obstacles, fast-growing and slow-growing segment analysis, COVID-19 impact and future consumer dynamics, and market condition analysis for the forecast period. |
|
Customization purview |
If our report has not included the data that you are looking for, you can reach out to our analysts and get segments customized. |
Browse Industrials Market Reports
Table Of Contents
1 Executive Summary
- 1.1 Market overview
- Exhibit 01: Executive Summary – Chart on Market Overview
- Exhibit 02: Executive Summary – Data Table on Market Overview
- Exhibit 03: Executive Summary – Chart on Global Market Characteristics
- Exhibit 04: Executive Summary – Chart on Market by Geography
- Exhibit 05: Executive Summary – Chart on Market Segmentation by End-user
- Exhibit 06: Executive Summary – Chart on Incremental Growth
- Exhibit 07: Executive Summary – Data Table on Incremental Growth
- Exhibit 08: Executive Summary – Chart on Vendor Market Positioning
2 Market Landscape
- 2.1 Market ecosystem
- Exhibit 09: Parent market
- Exhibit 10: Market Characteristics
3 Market Sizing
- 3.1 Market definition
- Exhibit 11: Offerings of vendors included in the market definition
- 3.2 Market segment analysis
- Exhibit 12: Market segments
- 3.3 Market size 2021
- 3.4 Market outlook: Forecast for 2021-2026
- Exhibit 13: Chart on Global – Market size and forecast 2021-2026 ($ million)
- Exhibit 14: Data Table on Global – Market size and forecast 2021-2026 ($ million)
- Exhibit 15: Chart on Global Market: Year-over-year growth 2021-2026 (%)
- Exhibit 16: Data Table on Global Market: Year-over-year growth 2021-2026 (%)
4 Five Forces Analysis
- 4.1 Five forces summary
- Exhibit 17: Five forces analysis – Comparison between 2021 and 2026
- 4.2 Bargaining power of buyers
- Exhibit 18: Chart on Bargaining power of buyers – Impact of key factors 2021 and 2026
- 4.3 Bargaining power of suppliers
- Exhibit 19: Bargaining power of suppliers – Impact of key factors in 2021 and 2026
- 4.4 Threat of new entrants
- Exhibit 20: Threat of new entrants – Impact of key factors in 2021 and 2026
- 4.5 Threat of substitutes
- Exhibit 21: Threat of substitutes – Impact of key factors in 2021 and 2026
- 4.6 Threat of rivalry
- Exhibit 22: Threat of rivalry – Impact of key factors in 2021 and 2026
- 4.7 Market condition
- Exhibit 23: Chart on Market condition – Five forces 2021 and 2026
5 Market Segmentation by End-user
- 5.1 Market segments
- Exhibit 24: Chart on End-user – Market share 2021-2026 (%)
- Exhibit 25: Data Table on End-user – Market share 2021-2026 (%)
- 5.2 Comparison by End-user
- Exhibit 26: Chart on Comparison by End-user
- Exhibit 27: Data Table on Comparison by End-user
- 5.3 Commercial – Market size and forecast 2021-2026
- Exhibit 28: Chart on Commercial – Market size and forecast 2021-2026 ($ million)
- Exhibit 29: Data Table on Commercial – Market size and forecast 2021-2026 ($ million)
- Exhibit 30: Chart on Commercial – Year-over-year growth 2021-2026 (%)
- Exhibit 31: Data Table on Commercial – Year-over-year growth 2021-2026 (%)
- 5.4 Residential – Market size and forecast 2021-2026
- Exhibit 32: Chart on Residential – Market size and forecast 2021-2026 ($ million)
- Exhibit 33: Data Table on Residential – Market size and forecast 2021-2026 ($ million)
- Exhibit 34: Chart on Residential – Year-over-year growth 2021-2026 (%)
- Exhibit 35: Data Table on Residential – Year-over-year growth 2021-2026 (%)
- 5.5 Market opportunity by End-user
- Exhibit 36: Market opportunity by End-user ($ million)
6 Customer Landscape
- 6.1 Customer landscape overview
- Exhibit 37: Analysis of price sensitivity, lifecycle, customer purchase basket, adoption rates, and purchase criteria
7 Geographic Landscape
- 7.1 Geographic segmentation
- Exhibit 38: Chart on Market share by geography 2021-2026 (%)
- Exhibit 39: Data Table on Market share by geography 2021-2026 (%)
- 7.2 Geographic comparison
- Exhibit 40: Chart on Geographic comparison
- Exhibit 41: Data Table on Geographic comparison
- 7.3 APAC – Market size and forecast 2021-2026
- Exhibit 42: Chart on APAC – Market size and forecast 2021-2026 ($ million)
- Exhibit 43: Data Table on APAC – Market size and forecast 2021-2026 ($ million)
- Exhibit 44: Chart on APAC – Year-over-year growth 2021-2026 (%)
- Exhibit 45: Data Table on APAC – Year-over-year growth 2021-2026 (%)
- 7.4 North America – Market size and forecast 2021-2026
- Exhibit 46: Chart on North America – Market size and forecast 2021-2026 ($ million)
- Exhibit 47: Data Table on North America – Market size and forecast 2021-2026 ($ million)
- Exhibit 48: Chart on North America – Year-over-year growth 2021-2026 (%)
- Exhibit 49: Data Table on North America – Year-over-year growth 2021-2026 (%)
- 7.5 Europe – Market size and forecast 2021-2026
- Exhibit 50: Chart on Europe – Market size and forecast 2021-2026 ($ million)
- Exhibit 51: Data Table on Europe – Market size and forecast 2021-2026 ($ million)
- Exhibit 52: Chart on Europe – Year-over-year growth 2021-2026 (%)
- Exhibit 53: Data Table on Europe – Year-over-year growth 2021-2026 (%)
- 7.6 South America – Market size and forecast 2021-2026
- Exhibit 54: Chart on South America – Market size and forecast 2021-2026 ($ million)
- Exhibit 55: Data Table on South America – Market size and forecast 2021-2026 ($ million)
- Exhibit 56: Chart on South America – Year-over-year growth 2021-2026 (%)
- Exhibit 57: Data Table on South America – Year-over-year growth 2021-2026 (%)
- 7.7 Middle East and Africa – Market size and forecast 2021-2026
- Exhibit 58: Chart on Middle East and Africa – Market size and forecast 2021-2026 ($ million)
- Exhibit 59: Data Table on Middle East and Africa – Market size and forecast 2021-2026 ($ million)
- Exhibit 60: Chart on Middle East and Africa – Year-over-year growth 2021-2026 (%)
- Exhibit 61: Data Table on Middle East and Africa – Year-over-year growth 2021-2026 (%)
- 7.8 China – Market size and forecast 2021-2026
- Exhibit 62: Chart on China – Market size and forecast 2021-2026 ($ million)
- Exhibit 63: Data Table on China – Market size and forecast 2021-2026 ($ million)
- Exhibit 64: Chart on China – Year-over-year growth 2021-2026 (%)
- Exhibit 65: Data Table on China – Year-over-year growth 2021-2026 (%)
- 7.9 US – Market size and forecast 2021-2026
- Exhibit 66: Chart on US – Market size and forecast 2021-2026 ($ million)
- Exhibit 67: Data Table on US – Market size and forecast 2021-2026 ($ million)
- Exhibit 68: Chart on US – Year-over-year growth 2021-2026 (%)
- Exhibit 69: Data Table on US – Year-over-year growth 2021-2026 (%)
- 7.10 India – Market size and forecast 2021-2026
- Exhibit 70: Chart on India – Market size and forecast 2021-2026 ($ million)
- Exhibit 71: Data Table on India – Market size and forecast 2021-2026 ($ million)
- Exhibit 72: Chart on India – Year-over-year growth 2021-2026 (%)
- Exhibit 73: Data Table on India – Year-over-year growth 2021-2026 (%)
- 7.11 Japan – Market size and forecast 2021-2026
- Exhibit 74: Chart on Japan – Market size and forecast 2021-2026 ($ million)
- Exhibit 75: Data Table on Japan – Market size and forecast 2021-2026 ($ million)
- Exhibit 76: Chart on Japan – Year-over-year growth 2021-2026 (%)
- Exhibit 77: Data Table on Japan – Year-over-year growth 2021-2026 (%)
- 7.12 Germany – Market size and forecast 2021-2026
- Exhibit 78: Chart on Germany – Market size and forecast 2021-2026 ($ million)
- Exhibit 79: Data Table on Germany – Market size and forecast 2021-2026 ($ million)
- Exhibit 80: Chart on Germany – Year-over-year growth 2021-2026 (%)
- Exhibit 81: Data Table on Germany – Year-over-year growth 2021-2026 (%)
- 7.13 Market opportunity by geography
- Exhibit 82: Market opportunity by geography ($ million)
8 Drivers, Challenges, and Trends
- 8.1 Market drivers
- 8.2 Market challenges
- 8.3 Impact of drivers and challenges
- Exhibit 83: Impact of drivers and challenges in 2021 and 2026
- 8.4 Market trends
9 Vendor Landscape
- 9.1 Overview
- 9.2 Vendor landscape
- Exhibit 84: Overview on Criticality of inputs and Factors of differentiation
- 9.3 Landscape disruption
- Exhibit 85: Overview on factors of disruption
- 9.4 Industry risks
- Exhibit 86: Impact of key risks on business
10 Vendor Analysis
- 10.1 Vendors covered
- Exhibit 87: Vendors covered
- 10.2 Market positioning of vendors
- Exhibit 88: Matrix on vendor position and classification
- 10.3 Allied Motion Technologies Inc.
- Exhibit 89: Allied Motion Technologies Inc. – Overview
- Exhibit 90: Allied Motion Technologies Inc. – Product / Service
- Exhibit 91: Allied Motion Technologies Inc. – Key offerings
- 10.4 Atomberg Technologies Pvt. Ltd.
- Exhibit 92: Atomberg Technologies Pvt. Ltd. – Overview
- Exhibit 93: Atomberg Technologies Pvt. Ltd. – Product / Service
- Exhibit 94: Atomberg Technologies Pvt. Ltd. – Key offerings
- 10.5 Brilltech Vayu
- Exhibit 95: Brilltech Vayu – Overview
- Exhibit 96: Brilltech Vayu – Product / Service
- Exhibit 97: Brilltech Vayu – Key offerings
- 10.6 Crompton Greaves Consumer Electricals Ltd.
- Exhibit 98: Crompton Greaves Consumer Electricals Ltd. – Overview
- Exhibit 99: Crompton Greaves Consumer Electricals Ltd. – Business segments
- Exhibit 100: Crompton Greaves Consumer Electricals Ltd. – Key offerings
- Exhibit 101: Crompton Greaves Consumer Electricals Ltd. – Segment focus
- 10.7 Fantasia Distribution Ltd.
- Exhibit 102: Fantasia Distribution Ltd. – Overview
- Exhibit 103: Fantasia Distribution Ltd. – Product / Service
- Exhibit 104: Fantasia Distribution Ltd. – Key offerings
- 10.8 Havells India Ltd.
- Exhibit 105: Havells India Ltd. – Overview
- Exhibit 106: Havells India Ltd. – Business segments
- Exhibit 107: Havells India Ltd. – Key news
- Exhibit 108: Havells India Ltd. – Key offerings
- Exhibit 109: Havells India Ltd. – Segment focus
- 10.9 OCECO ENERGY Pvt. Ltd.
- Exhibit 110: OCECO ENERGY Pvt. Ltd. – Overview
- Exhibit 111: OCECO ENERGY Pvt. Ltd. – Product / Service
- Exhibit 112: OCECO ENERGY Pvt. Ltd. – Key offerings
- 10.10 Orient Electric Ltd.
- Exhibit 113: Orient Electric Ltd. – Overview
- Exhibit 114: Orient Electric Ltd. – Business segments
- Exhibit 115: Orient Electric Ltd. – Key news
- Exhibit 116: Orient Electric Ltd. – Key offerings
- Exhibit 117: Orient Electric Ltd. – Segment focus
- 10.11 Perfect Enterprises
- Exhibit 118: Perfect Enterprises – Overview
- Exhibit 119: Perfect Enterprises – Product / Service
- Exhibit 120: Perfect Enterprises – Key offerings
- 10.12 Versa Drives Pvt Ltd.
- Exhibit 121: Versa Drives Pvt Ltd. – Overview
- Exhibit 122: Versa Drives Pvt Ltd. – Product / Service
- Exhibit 123: Versa Drives Pvt Ltd. – Key offerings
11 Appendix
- 11.1 Scope of the report
- 11.2 Inclusions and exclusions checklist
- Exhibit 124: Inclusions checklist
- Exhibit 125: Exclusions checklist
- 11.3 Currency conversion rates for US$
- Exhibit 126: Currency conversion rates for US$
- 11.4 Research methodology
- Exhibit 127: Research methodology
- Exhibit 128: Validation techniques employed for market sizing
- Exhibit 129: Information sources
- 11.5 List of abbreviations
- Exhibit 130: List of abbreviations
Technavio is a leading global technology research and advisory company. Their research and analysis focus on emerging market trends and provide actionable insights to help businesses identify market opportunities and develop effective strategies to optimize their market positions. With over 500 specialized analysts, Technavio’s report library consists of more than 17,000 reports and counting, covering 800 technologies, spanning across 50 countries. Their client base consists of enterprises of all sizes, including more than 100 Fortune 500 companies. This growing client base relies on Technavio’s comprehensive coverage, extensive research, and actionable market insights to identify opportunities in existing and potential markets and assess their competitive positions within changing market scenarios.
Technavio Research
Jesse Maida
Media & Marketing Executive
US: +1 844 364 1100
UK: +44 203 893 3200
Email: media@technavio.com
Website: www.technavio.com/
![]()
![]() View original content to download multimedia:https://www.prnewswire.com/news-releases/bldc-fan-market-to-record-a-cagr-of-7-56-allied-motion-technologies-inc-and-atomberg-technologies-pvt-ltd-among-key-vendors—technavio-301610634.html
View original content to download multimedia:https://www.prnewswire.com/news-releases/bldc-fan-market-to-record-a-cagr-of-7-56-allied-motion-technologies-inc-and-atomberg-technologies-pvt-ltd-among-key-vendors—technavio-301610634.html
SOURCE Technavio

Source link
The content is by PR Newswire. Headlines of Today Media is not responsible for the content provided or any links related to this content. Headlines of Today Media is not responsible for the correctness, topicality or the quality of the content.