NEW YORK, Sept. 30, 2022 /PRNewswire/ — The global baby travel bags market is fragmented due to the presence of several established vendors offering a wide range of products. The vendors in the market are incorporating automation in the manufacturing process. They are differentiating themselves in terms of quality, regulatory compliance, and product innovation. However, the price differentiation among vendors is low as the products are made of similar raw materials and designs. Organic growth in the market has a moderate impact on disruption, while inorganic growth is having a low emphasis because of negligible M&A activities. Get deeper insights into the vendor landscape, product launches, and competitive scenario by purchasing our full report. Download PDF Report Sample before purchasing

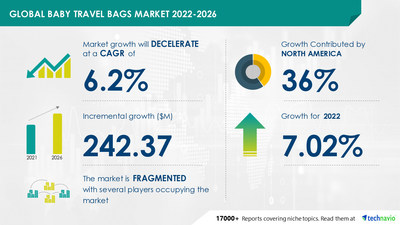
The global baby travel bags market size is expected to grow by USD 242.37 million between 2021 and 2026. However, the growth momentum is expected to decelerate at a CAGR of 6.2% during the forecast period.
is driven by the changing lifestyles coupled with the rise in single-parent and nuclear families. Baby travel bags have well-organized compartments to store essential baby products such as baby bottles and baby diapers. They are also hassle-free and can be used for other day-to-day purposes. Thus making it convenient and easy for single-parent and nuclear families while traveling. With the rise in the number of nuclear families, in both developed and developing countries, the demand for baby travel bags is expected to increase during the forecast period.
In addition, the introduction of multi-featured baby travel bags is anticipated to further boost the growth of the baby travel bags market. However, the declining birth rate in developed countries will challenge the growth of the market.
Major Baby Travel Bags Companies:
- 2 Red Hens Collections: The company offers baby travel bags namely Rooster diaper bags.
- Active Doodie Gear: The company offers baby travel bags namely Active Doodie dad diaper bags.
- Britax Child Safety Inc.: The company offers baby travel bags such as car seat bags.
- Carters Inc.: The company offers baby travel bags such as diaper bags, hip packs, and backpacks.
- Elodie Details AB: The company offers baby travel bags such as changing bags, toiletry bags, and backpacks.
- Albee Baby Carriage Co. Inc.
- Brainbees Solutions Pvt. Ltd.
- Guccio Gucci Spa
- hap tim.com Inc.
- Itzy Ritzy
- JuJuBe
- OiOi Pty Ltd.
- Parker Baby Co.
- Petunia Pickle Bottom
- Sanrio Co. Ltd.
- Storksak Ltd.
- The ERGObaby Carrier Inc.
- TOMY International Inc.
- Wenger SA
- Xiamen Worthfind Imp. and Exp. Co. Ltd.
Baby Travel Bags Market Distribution Channel Outlook (Revenue, USD Million, 2021-2026)
- Offline – size and forecast 2021-2026
- Online – size and forecast 2021-2026
The offline segment accounted for maximum sales in the market in 2021. However, the revenue of the offline distribution channel has been declining gradually over the years due to a shift in consumer preference for online shopping. To fuel the sales through offline channels, players are focusing on their store expansion in the local and regional markets.
Baby Travel Bags Market Geography Outlook (Revenue, USD Million, 2021-2026)
- Europe – size and forecast 2021-2026
- North America – size and forecast 2021-2026
- APAC – size and forecast 2021-2026
- The Middle East and Africa – size and forecast 2021-2026
- South America – size and forecast 2021-2026
North America will dominate the market growth, occupying 36% of the global market share. The regional market is driven by the high spending power of the population and the wide presence of luxury brands across North America. Technavio’s sample reports are free of charge and contain multiple sections of the report, such as the market size and forecast, drivers, challenges, trends, and more. Request Sample Report Here
Related Reports:
- Travel and Business Bags Market Growth, Size, Trends, Analysis Report by Type, Application, Region and Segment Forecast 2022-2026
- Camping Furniture Market by Distribution Channel, Product, and Geography – Forecast and Analysis 2022-2026
|
Baby Travel Bags Market Scope |
|
|
Report Coverage |
Details |
|
Page number |
120 |
|
Base year |
2021 |
|
Forecast period |
2022-2026 |
|
Growth momentum & CAGR |
Decelerate at a CAGR of 6.2% |
|
Market growth 2022-2026 |
USD 242.37 million |
|
Market structure |
Fragmented |
|
YoY growth (%) |
7.02 |
|
Regional analysis |
Europe, North America, APAC, Middle East and Africa, and South America |
|
Performing market contribution |
North America at 36% |
|
Key consumer countries |
US, China, France, UK, and Germany |
|
Competitive landscape |
Leading companies, competitive strategies, consumer engagement scope |
|
Companies profiled |
2 Red Hens Collections, Active Doodie Gear, Albee Baby Carriage Co. Inc., Brainbees Solutions Pvt. Ltd., Britax Child Safety Inc., Carters Inc., Elodie Details AB, Guccio Gucci Spa, hap tim.com Inc., Itzy Ritzy, JuJuBe, OiOi Pty Ltd., Parker Baby Co., Petunia Pickle Bottom, Sanrio Co. Ltd., Storksak Ltd., The ERGObaby Carrier Inc., TOMY International Inc., Wenger SA, and Xiamen Worthfind Imp. and Exp. Co. Ltd. |
|
Market Dynamics |
Parent market analysis, Market growth inducers and obstacles, Fast-growing and slow-growing segment analysis, COVID-19 impact and future consumer dynamics, and market condition analysis for the forecast period. |
|
Customization purview |
If our report has not included the data that you are looking for, you can reach out to our analysts and get segments customized. |
1 Executive Summary
- 1.1 Market overview
- Exhibit 01: Executive Summary – Chart on Market Overview
- Exhibit 02: Executive Summary – Data Table on Market Overview
- Exhibit 03: Executive Summary – Chart on Global Market Characteristics
- Exhibit 04: Executive Summary – Chart on Market by Geography
- Exhibit 05: Executive Summary – Chart on Market Segmentation by Distribution Channel
- Exhibit 06: Executive Summary – Chart on Incremental Growth
- Exhibit 07: Executive Summary – Data Table on Incremental Growth
- Exhibit 08: Executive Summary – Chart on Vendor Market Positioning
2 Market Landscape
- 2.1 Market ecosystem
- Exhibit 09: Parent market
- Exhibit 10: Market Characteristics
3 Market Sizing
- 3.1 Market definition
- Exhibit 11: Offerings of vendors included in the market definition
- 3.2 Market segment analysis
- Exhibit 12: Market segments
- 3.3 Market size 2021
- 3.4 Market outlook: Forecast for 2021-2026
- Exhibit 13: Chart on Global – Market size and forecast 2021-2026 ($ million)
- Exhibit 14: Data Table on Global – Market size and forecast 2021-2026 ($ million)
- Exhibit 15: Chart on Global Market: Year-over-year growth 2021-2026 (%)
- Exhibit 16: Data Table on Global Market: Year-over-year growth 2021-2026 (%)
4 Five Forces Analysis
- 4.1 Five forces summary
- Exhibit 17: Five forces analysis – Comparison between 2021 and 2026
- 4.2 Bargaining power of buyers
- Exhibit 18: Chart on Bargaining power of buyers – Impact of key factors 2021 and 2026
- 4.3 Bargaining power of suppliers
- Exhibit 19: Bargaining power of suppliers – Impact of key factors in 2021 and 2026
- 4.4 Threat of new entrants
- Exhibit 20: Threat of new entrants – Impact of key factors in 2021 and 2026
- 4.5 Threat of substitutes
- Exhibit 21: Threat of substitutes – Impact of key factors in 2021 and 2026
- 4.6 Threat of rivalry
- Exhibit 22: Threat of rivalry – Impact of key factors in 2021 and 2026
- 4.7 Market condition
- Exhibit 23: Chart on Market condition – Five forces 2021 and 2026
5 Market Segmentation by Distribution Channel
- 5.1 Market segments
- Exhibit 24: Chart on Distribution Channel – Market share 2021-2026 (%)
- Exhibit 25: Data Table on Distribution Channel – Market share 2021-2026 (%)
- 5.2 Comparison by Distribution Channel
- Exhibit 26: Chart on Comparison by Distribution Channel
- Exhibit 27: Data Table on Comparison by Distribution Channel
- 5.3 Offline – Market size and forecast 2021-2026
- Exhibit 28: Chart on Offline – Market size and forecast 2021-2026 ($ million)
- Exhibit 29: Data Table on Offline – Market size and forecast 2021-2026 ($ million)
- Exhibit 30: Chart on Offline – Year-over-year growth 2021-2026 (%)
- Exhibit 31: Data Table on Offline – Year-over-year growth 2021-2026 (%)
- 5.4 Online – Market size and forecast 2021-2026
- Exhibit 32: Chart on Online – Market size and forecast 2021-2026 ($ million)
- Exhibit 33: Data Table on Online – Market size and forecast 2021-2026 ($ million)
- Exhibit 34: Chart on Online – Year-over-year growth 2021-2026 (%)
- Exhibit 35: Data Table on Online – Year-over-year growth 2021-2026 (%)
- 5.5 Market opportunity by Distribution Channel
- Exhibit 36: Market opportunity by Distribution Channel ($ million)
6 Customer Landscape
- 6.1 Customer landscape overview
- Exhibit 37: Analysis of price sensitivity, lifecycle, customer purchase basket, adoption rates, and purchase criteria
7 Geographic Landscape
- 7.1 Geographic segmentation
- Exhibit 38: Chart on Market share by geography 2021-2026 (%)
- Exhibit 39: Data Table on Market share by geography 2021-2026 (%)
- 7.2 Geographic comparison
- Exhibit 40: Chart on Geographic comparison
- Exhibit 41: Data Table on Geographic comparison
- 7.3 Europe – Market size and forecast 2021-2026
- Exhibit 42: Chart on Europe – Market size and forecast 2021-2026 ($ million)
- Exhibit 43: Data Table on Europe – Market size and forecast 2021-2026 ($ million)
- Exhibit 44: Chart on Europe – Year-over-year growth 2021-2026 (%)
- Exhibit 45: Data Table on Europe – Year-over-year growth 2021-2026 (%)
- 7.4 North America – Market size and forecast 2021-2026
- Exhibit 46: Chart on North America – Market size and forecast 2021-2026 ($ million)
- Exhibit 47: Data Table on North America – Market size and forecast 2021-2026 ($ million)
- Exhibit 48: Chart on North America – Year-over-year growth 2021-2026 (%)
- Exhibit 49: Data Table on North America – Year-over-year growth 2021-2026 (%)
- 7.5 APAC – Market size and forecast 2021-2026
- Exhibit 50: Chart on APAC – Market size and forecast 2021-2026 ($ million)
- Exhibit 51: Data Table on APAC – Market size and forecast 2021-2026 ($ million)
- Exhibit 52: Chart on APAC – Year-over-year growth 2021-2026 (%)
- Exhibit 53: Data Table on APAC – Year-over-year growth 2021-2026 (%)
- 7.6 Middle East and Africa – Market size and forecast 2021-2026
- Exhibit 54: Chart on Middle East and Africa – Market size and forecast 2021-2026 ($ million)
- Exhibit 55: Data Table on Middle East and Africa – Market size and forecast 2021-2026 ($ million)
- Exhibit 56: Chart on Middle East and Africa – Year-over-year growth 2021-2026 (%)
- Exhibit 57: Data Table on Middle East and Africa – Year-over-year growth 2021-2026 (%)
- 7.7 South America – Market size and forecast 2021-2026
- Exhibit 58: Chart on South America – Market size and forecast 2021-2026 ($ million)
- Exhibit 59: Data Table on South America – Market size and forecast 2021-2026 ($ million)
- Exhibit 60: Chart on South America – Year-over-year growth 2021-2026 (%)
- Exhibit 61: Data Table on South America – Year-over-year growth 2021-2026 (%)
- 7.8 US – Market size and forecast 2021-2026
- Exhibit 62: Chart on US – Market size and forecast 2021-2026 ($ million)
- Exhibit 63: Data Table on US – Market size and forecast 2021-2026 ($ million)
- Exhibit 64: Chart on US – Year-over-year growth 2021-2026 (%)
- Exhibit 65: Data Table on US – Year-over-year growth 2021-2026 (%)
- 7.9 China – Market size and forecast 2021-2026
- Exhibit 66: Chart on China – Market size and forecast 2021-2026 ($ million)
- Exhibit 67: Data Table on China – Market size and forecast 2021-2026 ($ million)
- Exhibit 68: Chart on China – Year-over-year growth 2021-2026 (%)
- Exhibit 69: Data Table on China – Year-over-year growth 2021-2026 (%)
- 7.10 France – Market size and forecast 2021-2026
- Exhibit 70: Chart on France – Market size and forecast 2021-2026 ($ million)
- Exhibit 71: Data Table on France – Market size and forecast 2021-2026 ($ million)
- Exhibit 72: Chart on France – Year-over-year growth 2021-2026 (%)
- Exhibit 73: Data Table on France – Year-over-year growth 2021-2026 (%)
- 7.11 UK – Market size and forecast 2021-2026
- Exhibit 74: Chart on UK – Market size and forecast 2021-2026 ($ million)
- Exhibit 75: Data Table on UK – Market size and forecast 2021-2026 ($ million)
- Exhibit 76: Chart on UK – Year-over-year growth 2021-2026 (%)
- Exhibit 77: Data Table on UK – Year-over-year growth 2021-2026 (%)
- 7.12 Germany – Market size and forecast 2021-2026
- Exhibit 78: Chart on Germany – Market size and forecast 2021-2026 ($ million)
- Exhibit 79: Data Table on Germany – Market size and forecast 2021-2026 ($ million)
- Exhibit 80: Chart on Germany – Year-over-year growth 2021-2026 (%)
- Exhibit 81: Data Table on Germany – Year-over-year growth 2021-2026 (%)
- 7.13 Market opportunity by geography
- Exhibit 82: Market opportunity by geography ($ million)
8 Drivers, Challenges, and Trends
- 8.1 Market drivers
- 8.2 Market challenges
- 8.3 Impact of drivers and challenges
- Exhibit 83: Impact of drivers and challenges in 2021 and 2026
- 8.4 Market trends
9 Vendor Landscape
- 9.1 Overview
- 9.2 Vendor landscape
- Exhibit 84: Overview on Criticality of inputs and Factors of differentiation
- 9.3 Landscape disruption
- Exhibit 85: Overview on factors of disruption
- 9.4 Industry risks
- Exhibit 86: Impact of key risks on business
10 Vendor Analysis
- 10.1 Vendors covered
- Exhibit 87: Vendors covered
- 10.2 Market positioning of vendors
- Exhibit 88: Matrix on vendor position and classification
- 10.3 2 Red Hens Collections
- Exhibit 89: 2 Red Hens Collections – Overview
- Exhibit 90: 2 Red Hens Collections – Product / Service
- Exhibit 91: 2 Red Hens Collections – Key offerings
- 10.4 Active Doodie Gear
- Exhibit 92: Active Doodie Gear – Overview
- Exhibit 93: Active Doodie Gear – Product / Service
- Exhibit 94: Active Doodie Gear – Key offerings
- 10.5 Britax Child Safety Inc.
- Exhibit 95: Britax Child Safety Inc. – Overview
- Exhibit 96: Britax Child Safety Inc. – Product / Service
- Exhibit 97: Britax Child Safety Inc. – Key offerings
- 10.6 Carters Inc.
- Exhibit 98: Carters Inc. – Overview
- Exhibit 99: Carters Inc. – Business segments
- Exhibit 100: Carters Inc. – Key offerings
- Exhibit 101: Carters Inc. – Segment focus
- 10.7 Elodie Details AB
- Exhibit 102: Elodie Details AB – Overview
- Exhibit 103: Elodie Details AB – Product / Service
- Exhibit 104: Elodie Details AB – Key offerings
- 10.8 hap tim.com Inc.
- Exhibit 105: hap tim.com Inc. – Overview
- Exhibit 106: hap tim.com Inc. – Product / Service
- Exhibit 107: hap tim.com Inc. – Key offerings
- 10.9 Itzy Ritzy
- Exhibit 108: Itzy Ritzy – Overview
- Exhibit 109: Itzy Ritzy – Product / Service
- Exhibit 110: Itzy Ritzy – Key offerings
- 10.10 Sanrio Co. Ltd.
- Exhibit 111: Sanrio Co. Ltd. – Overview
- Exhibit 112: Sanrio Co. Ltd. – Product / Service
- Exhibit 113: Sanrio Co. Ltd. – Key offerings
- 10.11 The ERGObaby Carrier Inc.
- Exhibit 114: The ERGObaby Carrier Inc. – Overview
- Exhibit 115: The ERGObaby Carrier Inc. – Product / Service
- Exhibit 116: The ERGObaby Carrier Inc. – Key offerings
- 10.12 TOMY International Inc.
- Exhibit 117: TOMY International Inc. – Overview
- Exhibit 118: TOMY International Inc. – Product / Service
- Exhibit 119: TOMY International Inc. – Key offerings
11 Appendix
- 11.1 Scope of the report
- 11.2 Inclusions and exclusions checklist
- Exhibit 120: Inclusions checklist
- Exhibit 121: Exclusions checklist
- 11.3 Currency conversion rates for US$
- Exhibit 122: Currency conversion rates for US$
- 11.4 Research methodology
- Exhibit 123: Research methodology
- Exhibit 124: Validation techniques employed for market sizing
- Exhibit 125: Information sources
- 11.5 List of abbreviations
- Exhibit 126: List of abbreviations
Technavio is a leading global technology research and advisory company. Their research and analysis focus on emerging market trends and provides actionable insights to help businesses identify market opportunities and develop effective strategies to optimize their market positions.
With over 500 specialized analysts, Technavio’s report library consists of more than 17,000 reports and counting, covering 800 technologies, spanning across 50 countries. Their client base consists of enterprises of all sizes, including more than 100 Fortune 500 companies. This growing client base relies on Technavio’s comprehensive coverage, extensive research, and actionable market insights to identify opportunities in existing and potential markets and assess their competitive positions within changing market scenarios.
Technavio Research
Jesse Maida
Media & Marketing Executive
US: +1 844 364 1100
UK: +44 203 893 3200
Email: media@technavio.com
Website: www.technavio.com/
![]()
![]() View original content to download multimedia:https://www.prnewswire.com/news-releases/baby-travel-bags-market-to-record-usd-242-37-mn-incremental-growth–north-america-to-have-a-significant-share-301635801.html
View original content to download multimedia:https://www.prnewswire.com/news-releases/baby-travel-bags-market-to-record-usd-242-37-mn-incremental-growth–north-america-to-have-a-significant-share-301635801.html
SOURCE Technavio

Source link
The content is by PR Newswire. Headlines of Today Media is not responsible for the content provided or any links related to this content. Headlines of Today Media is not responsible for the correctness, topicality or the quality of the content.