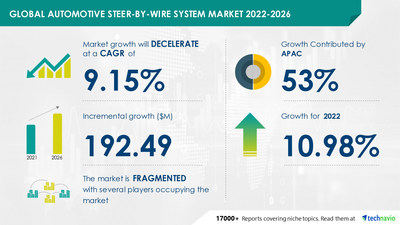
NEW YORK, Aug. 3, 2022 /PRNewswire/ — According to the latest market research report titled Automotive Steer-by-wire System Market, segmented by Technology (Backup mechanical and Pure electronic) and Geography (APAC, North America, Europe, South America, and the Middle East and Africa) from Technavio, the market is expected to expand by USD 192.49 million. The growth can be mainly attributed to the surging growth of the wellness industry.

Frequently Asked Questions:
- Based on segmentation by Technology, which is the leading segment in the market?
- What are the major trends in the market?
- At what rate is the market projected to grow?
- Who are the top players in the market?
- What are the key market drivers and challenges?
- How big is the APAC market
The market is fragmented, and the degree of fragmentation will decelerate during the forecast period. AB SKF, China Automotive Systems Inc., Danfoss AS, Eaton Corp. Plc, Georgsmarienhutte Holding GmbH, Hitachi Ltd., Hyundai Motor Co., Infineon Technologies AG, JTEKT Corp., KYB Corp., Mando Corp., Nexteer Automotive Group Ltd., Nissan Motor Co. Ltd., NSK Ltd., PARAVAN GmbH, Parker Hannifin Corp., Robert Bosch GmbH, Schaeffler AG, thyssenkrupp AG, and ZF Friedrichshafen AG are some of the major market participants. Request Free Sample Report.
The benefits of the SBW system, electrification of vehicles, and the emergence of autonomous vehicles will offer immense growth opportunities. However, the system reliability issues and acceptance level among consumers are likely to pose a challenge for the market vendors.
In a bid to help players strengthen their market foothold, this automotive steer-by-wire system market forecast report provides a detailed analysis of the leading market vendors. The report also empowers industry honchos with information on the competitive landscape and insights into the different product offerings offered by various companies. Request Free Sample Report.
Automotive Steer-by-wire System Market Segmentation
- Technology
- Backup Mechanical
- Pure Electronic
- Geography
- APAC
- North America
- Europe
- South America
- The Middle East And Africa
Grab access to the automotive steer-by-wire system market sample report outlook for effective decision making – Here
Automotive Steer-by-wire System Market Scope
Technavio presents a detailed picture of the market by way of study, synthesis, and summation of data from multiple sources. The automotive steer-by-wire system market report covers the following areas:
- Automotive Steer-by-wire System Market Size
- Automotive Steer-by-wire System Market Trends
- Automotive Steer-by-wire System Market Industry Analysis
This study identifies the growing implementation of advanced steering systems in vehicles as one of the prime reasons driving the Automotive Steer-by-wire System Market growth during the next few years. Buy Sample Report.
Related Reports:
Two-wheeler Ignition Switch Market Growth, Size, Trends, Analysis Report by Type, Application, Region, and Segment Forecast 2022-2026: The two-wheeler ignition switch market share is expected to increase to USD 221.48 million from 2021 to 2026, and the market’s growth momentum will accelerate at a CAGR of 5.58%.
Automotive Paddle Shifter System Market by Application and Geography – Forecast and Analysis 2022-2026: The automotive paddle shifter system market share is expected to increase to 9.01 billion units from 2021 to 2026, and the market’s growth momentum will accelerate at a CAGR of 6.74%.
|
Automotive Steer-by-Wire System Market Scope |
|
|
Report Coverage |
Details |
|
Page number |
120 |
|
Base year |
2021 |
|
Forecast period |
2022-2026 |
|
Growth momentum & CAGR |
Decelerate at a CAGR of 9.15% |
|
Market growth 2022-2026 |
$ 192.49 million |
|
Market structure |
Fragmented |
|
YoY growth (%) |
10.98 |
|
Regional analysis |
APAC, North America, Europe, South America, Middle East, and Africa |
|
Performing market contribution |
APAC at 53% |
|
Key consumer countries |
US, China, Japan, India, Germany, and the UK |
|
Competitive landscape |
Leading companies, Competitive Strategies, Consumer engagement scope |
|
Key companies profiled |
AB SKF, China Automotive Systems Inc., Danfoss AS, Eaton Corp. Plc, Georgsmarienhutte Holding GmbH, Hitachi Ltd., Hyundai Motor Co., Infineon Technologies AG, JTEKT Corp., KYB Corp., Mando Corp., Nexteer Automotive Group Ltd., Nissan Motor Co. Ltd., NSK Ltd., PARAVAN GmbH, Parker Hannifin Corp., Robert Bosch GmbH, Schaeffler AG, thyssenkrupp AG, and ZF Friedrichshafen AG |
|
Market dynamics |
Parent market analysis, Market growth inducers and obstacles, Fast-growing and slow-growing segment analysis, COVID 19 impact and recovery analysis and future consumer dynamics, and Market condition analysis for the forecast period. |
|
Customization purview |
If our report has not included the data that you are looking for, you can reach out to our analysts and get segments customized. |
Browse for Technavio “Consumer Discretionary” Research Reports
Table of Contents
1 Executive Summary
- 1.1 Market Overview
- Exhibit 01: Executive Summary – Chart on Market Overview
- Exhibit 02: Executive Summary – Data Table on Market Overview
- Exhibit 03: Executive Summary – Chart of Global Market Characteristics
- Exhibit 04: Executive Summary – Chart of Market by Geography
- Exhibit 05: Executive Summary – Chart on Market Segmentation by Technology
- Exhibit 06: Executive Summary – Chart on Incremental Growth
- Exhibit 07: Executive Summary – Data Table on Incremental Growth
- Exhibit 08: Executive Summary – Chart on Vendor Market Positioning
2 Market Landscape
- 2.1 Market ecosystem
- Exhibit 09: Parent market
- Exhibit 10: Market Characteristics
3 Market Sizing
- 3.1 Market Definition
- Exhibit 11: Offerings of vendors included in the market definition
- 3.2 Market segment analysis
- Exhibit 12: Market segments
- 3.3 Market size 2021
- 3.4 Market outlook: Forecast for 2021-2026
- Exhibit 13: Chart on Global – Market size and forecast 2021-2026 ($ million)
- Exhibit 14: Data Table on Global – Market size and forecast 2021-2026 ($ million)
- Exhibit 15: Chart on Global Market: Year-over-year growth 2021-2026 (%)
- Exhibit 16: Data Table on Global Market: Year-over-year growth 2021-2026 (%)
4 Five Forces Analysis
- 4.1 Five forces summary
- Exhibit 17: Five forces analysis – Comparison between 2021 and 2026
- 4.2 Bargaining power of buyers
- Exhibit 18: Chart on the Bargaining power of buyers – Impact of key factors 2021 and 2026
- 4.3 Bargaining power of suppliers
- Exhibit 19: Bargaining power of suppliers – Impact of key factors in 2021 and 2026
- 4.4 Threat of new entrants
- Exhibit 20: Threat of new entrants – Impact of key factors in 2021 and 2026
- 4.5 Threat of substitutes
- Exhibit 21: Threat of substitutes – Impact of key factors in 2021 and 2026
- 4.6 Threat of rivalry
- Exhibit 22: Threat of rivalry – Impact of key factors in 2021 and 2026
- 4.7 Market condition
- Exhibit 23: Chart of Market condition – Five forces 2021 and 2026
5 Market Segmentation by Technology
- 5.1 Market segments
- Exhibit 24: Chart on Technology – Market share 2021-2026 (%)
- Exhibit 25: Data Table on Technology – Market share 2021-2026 (%)
- 5.2 Comparison by Technology
- Exhibit 26: Chart of Comparison by Technology
- Exhibit 27: Data Table on Comparison by Technology
- 5.3 Backup mechanical – Market size and forecast 2021-2026
- Exhibit 28: Chart on Backup mechanical – Market size and forecast 2021-2026 ($ million)
- Exhibit 29: Data Table on Backup mechanical – Market size and forecast 2021-2026 ($ million)
- Exhibit 30: Chart on Backup mechanical – Year-over-year growth 2021-2026 (%)
- Exhibit 31: Data Table on Backup mechanical – Year-over-year growth 2021-2026 (%)
- 5.4 Pure electronic – Market size and forecast 2021-2026
- Exhibit 32: Chart on Pure electronic – Market size and forecast 2021-2026 ($ million)
- Exhibit 33: Data Table on Pure electronic – Market size and forecast 2021-2026 ($ million)
- Exhibit 34: Chart on Pure electronic – Year-over-year growth 2021-2026 (%)
- Exhibit 35: Data Table on Pure electronic – Year-over-year growth 2021-2026 (%)
- 5.5 Market opportunity by Technology
- Exhibit 36: Market opportunity by Technology ($ million)
6 Customer Landscape
- 6.1 Customer landscape overview
- Exhibit 37: Analysis of price sensitivity, lifecycle, customer purchase basket, adoption rates, and purchase criteria
7 Geographic Landscape
- 7.1 Geographic segmentation
- Exhibit 38: Chart of Market share by geography 2021-2026 (%)
- Exhibit 39: Data Table on Market share by geography 2021-2026 (%)
- 7.2 Geographic comparison
- Exhibit 40: Chart on Geographic comparison
- Exhibit 41: Data Table on Geographic comparison
- 7.3 APAC – Market size and forecast 2021-2026
- Exhibit 42: Chart on APAC – Market size and forecast 2021-2026 ($ million)
- Exhibit 43: Data Table on APAC – Market size and forecast 2021-2026 ($ million)
- Exhibit 44: Chart on APAC – Year-over-year growth 2021-2026 (%)
- Exhibit 45: Data Table on APAC – Year-over-year growth 2021-2026 (%)
- 7.4 North America – Market size and forecast 2021-2026
- Exhibit 46: Chart on North America – Market size and forecast 2021-2026 ($ million)
- Exhibit 47: Data Table on North America – Market size and forecast 2021-2026 ($ million)
- Exhibit 48: Chart on North America – Year-over-year growth 2021-2026 (%)
- Exhibit 49: Data Table on North America – Year-over-year growth 2021-2026 (%)
- 7.5 Europe – Market size and forecast 2021-2026
- Exhibit 50: Chart on Europe – Market size and forecast 2021-2026 ($ million)
- Exhibit 51: Data Table on Europe – Market size and forecast 2021-2026 ($ million)
- Exhibit 52: Chart on Europe – Year-over-year growth 2021-2026 (%)
- Exhibit 53: Data Table on Europe – Year-over-year growth 2021-2026 (%)
- 7.6 South America – Market size and forecast 2021-2026
- Exhibit 54: Chart on South America – Market size and forecast 2021-2026 ($ million)
- Exhibit 55: Data Table on South America – Market size and forecast 2021-2026 ($ million)
- Exhibit 56: Chart on South America – Year-over-year growth 2021-2026 (%)
- Exhibit 57: Data Table on South America – Year-over-year growth 2021-2026 (%)
- 7.7 the Middle East and Africa – Market size and forecast 2021-2026
- Exhibit 58: Chart of Middle East and Africa – Market size and forecast 2021-2026 ($ million)
- Exhibit 59: Data Table on the Middle East and Africa – Market size and forecast 2021-2026 ($ million)
- Exhibit 60: Chart on the Middle East and Africa – Year-over-year growth 2021-2026 (%)
- Exhibit 61: Data Table on the Middle East and Africa – Year-over-year growth 2021-2026 (%)
- 7.8 China – Market size and forecast 2021-2026
- Exhibit 62: Chart on China – Market size and forecast 2021-2026 ($ million)
- Exhibit 63: Data Table on China – Market size and forecast 2021-2026 ($ million)
- Exhibit 64: Chart on China – Year-over-year growth 2021-2026 (%)
- Exhibit 65: Data Table on China – Year-over-year growth 2021-2026 (%)
- 7.9 US – Market size and forecast 2021-2026
- Exhibit 66: Chart on the US – Market size and forecast 2021-2026 ($ million)
- Exhibit 67: Data Table on the US – Market size and forecast 2021-2026 ($ million)
- Exhibit 68: Chart on US – Year-over-year growth 2021-2026 (%)
- Exhibit 69: Data Table on the US – Year-over-year growth 2021-2026 (%)
- 7.10 Japan – Market size and forecast 2021-2026
- Exhibit 70: Chart on Japan – Market size and forecast 2021-2026 ($ million)
- Exhibit 71: Data Table on Japan – Market size and forecast 2021-2026 ($ million)
- Exhibit 72: Chart on Japan – Year-over-year growth 2021-2026 (%)
- Exhibit 73: Data Table on Japan – Year-over-year growth 2021-2026 (%)
- 7.11 India – Market size and forecast 2021-2026
- Exhibit 74: Chart on India – Market size and forecast 2021-2026 ($ million)
- Exhibit 75: Data Table on India – Market size and forecast 2021-2026 ($ million)
- Exhibit 76: Chart on India – Year-over-year growth 2021-2026 (%)
- Exhibit 77: Data Table on India – Year-over-year growth 2021-2026 (%)
- 7.12 Germany – Market size and forecast 2021-2026
- Exhibit 78: Chart on Germany – Market size and forecast 2021-2026 ($ million)
- Exhibit 79: Data Table on Germany – Market size and forecast 2021-2026 ($ million)
- Exhibit 80: Chart on Germany – Year-over-year growth 2021-2026 (%)
- Exhibit 81: Data Table on Germany – Year-over-year growth 2021-2026 (%)
- 7.13 UK – Market size and forecast 2021-2026
- Exhibit 82: Chart on the UK – Market size and forecast 2021-2026 ($ million)
- Exhibit 83: Data Table on the UK – Market size and forecast 2021-2026 ($ million)
- Exhibit 84: Chart on the UK – Year-over-year growth 2021-2026 (%)
- Exhibit 85: Data Table on the UK – Year-over-year growth 2021-2026 (%)
- 7.14 Market opportunity by geography
- Exhibit 86: Market opportunity by geography ($ million)
8 Drivers, Challenges, and Trends
- 8.1 Market drivers
- 8.2 Market challenges
- 8.3 Impact of drivers and challenges
- Exhibit 87: Impact of drivers and challenges in 2021 and 2026
- 8.4 Market trends
9 Vendor Landscape
- 9.1 Overview
- 9.2 Vendor landscape
- Exhibit 88: Overview of Criticality of inputs and Factors of differentiation
- 9.3 Landscape disruption
- Exhibit 89: Overview of factors of disruption
- 9.4 Industry risks
- Exhibit 90: Impact of key risks on business
10 Vendor Analysis
- 10.1 Vendors covered
- Exhibit 91: Vendors covered
- 10.2 Market positioning of vendors
- Exhibit 92: Matrix on vendor position and classification
- 10.3 AB SKF
- Exhibit 93: AB SKF – Overview
- Exhibit 94: AB SKF – Business segments
- Exhibit 95: AB SKF – Key news
- Exhibit 96: AB SKF – Key offerings
- Exhibit 97: AB SKF – Segment focus
- 10.4 Danfoss AS
- Exhibit 98: Danfoss AS – Overview
- Exhibit 99: Danfoss AS – Business segments
- Exhibit 100: Danfoss AS – Key news
- Exhibit 101: Danfoss AS – Key offerings
- Exhibit 102: Danfoss AS – Segment focus
- 10.5 JTEKT Corp.
- Exhibit 103: JTEKT Corp. – Overview
- Exhibit 104: JTEKT Corp. – Business segments
- Exhibit 105: JTEKT Corp. – Key news
- Exhibit 106: JTEKT Corp. – Key offerings
- Exhibit 107: JTEKT Corp. – Segment focus
- 10.6 Nexteer Automotive Group Ltd.
- Exhibit 108: Nexteer Automotive Group Ltd. – Overview
- Exhibit 109: Nexteer Automotive Group Ltd. – Business segments
- Exhibit 110: Nexteer Automotive Group Ltd. – Key news
- Exhibit 111: Nexteer Automotive Group Ltd. – Key offerings
- Exhibit 112: Nexteer Automotive Group Ltd. – Segment focus
- 10.7 Nissan Motor Co. Ltd.
- Exhibit 113: Nissan Motor Co. Ltd. – Overview
- Exhibit 114: Nissan Motor Co. Ltd. – Business segments
- Exhibit 115: Nissan Motor Co. Ltd. – Key news
- Exhibit 116: Nissan Motor Co. Ltd. – Key offerings
- Exhibit 117: Nissan Motor Co. Ltd. – Segment focus
- 10.8 PARAVAN GmbH
- Exhibit 118: PARAVAN GmbH – Overview
- Exhibit 119: PARAVAN GmbH – Product / Service
- Exhibit 120: PARAVAN GmbH – Key offerings
- 10.9 Parker Hannifin Corp.
- Exhibit 121: Parker Hannifin Corp. – Overview
- Exhibit 122: Parker Hannifin Corp. – Business segments
- Exhibit 123: Parker Hannifin Corp. – Key news
- Exhibit 124: Parker Hannifin Corp. – Key offerings
- Exhibit 125: Parker Hannifin Corp. – Segment focus
- 10.10 Robert Bosch GmbH
- Exhibit 126: Robert Bosch GmbH – Overview
- Exhibit 127: Robert Bosch GmbH – Business segments
- Exhibit 128: Robert Bosch GmbH – Key news
- Exhibit 129: Robert Bosch GmbH – Key offerings
- Exhibit 130: Robert Bosch GmbH – Segment focus
- 10.11 thyssenkrupp AG
- Exhibit 131: thyssenkrupp AG – Overview
- Exhibit 132: thyssenkrupp AG – Business segments
- Exhibit 133: thyssenkrupp AG – Key news
- Exhibit 134: thyssenkrupp AG – Key offerings
- Exhibit 135: thyssenkrupp AG – Segment focus
- 10.12 ZF Friedrichshafen AG
- Exhibit 136: ZF Friedrichshafen AG – Overview
- Exhibit 137: ZF Friedrichshafen AG – Business segments
- Exhibit 138: ZF Friedrichshafen AG – Key news
- Exhibit 139: ZF Friedrichshafen AG – Key offerings
- Exhibit 140: ZF Friedrichshafen AG – Segment focus
11 Appendix
- 11.1 Scope of the report
- 11.2 Inclusions and exclusions checklist
- Exhibit 141: Inclusions checklist
- Exhibit 142: Exclusions checklist
- 11.3 Currency conversion rates for US$
- Exhibit 143: Currency conversion rates for US$
- 11.4 Research methodology
- Exhibit 144: Research methodology
- Exhibit 145: Validation techniques employed for market sizing
- Exhibit 146: Information sources
- 11.5 List of abbreviations
- Exhibit 147: List of abbreviations
Technavio is a leading global technology research and advisory company. Their research and analysis focus on emerging market trends and provide actionable insights to help businesses identify market opportunities and develop effective strategies to optimize their market positions. With over 500 specialized analysts, Technavio’s report library consists of more than 17,000 reports and counting, covering 800 technologies, spanning 50 countries. Their client base consists of enterprises of all sizes, including more than 100 Fortune 500 companies. This growing client base relies on Technavio’s comprehensive coverage, extensive research, and actionable market insights to identify opportunities in existing and potential markets and assess their competitive positions within changing market scenarios.
Contact
Technavio Research
Jesse Maida
Media & Marketing Executive
US: +1 844 364 1100
UK: +44 203 893 3200
Email: media@technavio.com
Website: www.technavio.com/
![]()
![]() View original content to download multimedia:https://www.prnewswire.com/news-releases/automotive-steer-by-wire-system-market–industry-analysis-market-trends-market-growth-opportunities-and-forecast-incorporation-of-an-active-steering-system-in-sbw-to-boost-market-growth—technavio-301598164.html
View original content to download multimedia:https://www.prnewswire.com/news-releases/automotive-steer-by-wire-system-market–industry-analysis-market-trends-market-growth-opportunities-and-forecast-incorporation-of-an-active-steering-system-in-sbw-to-boost-market-growth—technavio-301598164.html
SOURCE Technavio

Source link
The content is by PR Newswire. Headlines of Today Media is not responsible for the content provided or any links related to this content. Headlines of Today Media is not responsible for the correctness, topicality or the quality of the content.