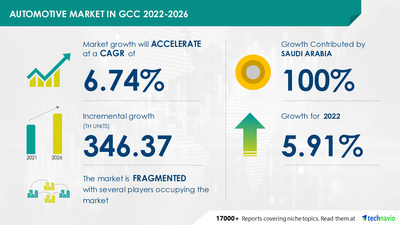
NEW YORK, Aug. 18, 2022 /PRNewswire/ — The “Automotive Market in GCC Growth, Size, Trends, Analysis Report by Type, Application, Region and Segment Forecast 2022-2026” report has been added to Techanvio’s offering. According to the report, the market will observe an incremental growth of 346.37 thousand units between 2021 and 2026, accelerating at a CAGR of 6.74% during the forecast period. The report provides a comprehensive analysis of recent developments, new product launches, major revenue-generating segments, and market behavior across geographies. Download Sample PDF Report Here

The automotive market in GCC is fragmented due to the presence of many established vendors offering innovative products. Some of the vendors are involved in M&As to gain access to new technologies and remain competitive in the market. For instance, in December 2021, Stellantis NV partnered with Foxconn to design and sell new flexible semiconductors for the automotive industry. Similarly, in December 2021, Volkswagen AG partnered with Umicore for the industrialization of battery technology.
BMW AG, Daimler AG, General Motors Co., Hyundai Motor Co., Kia Motors Corp., Mitsubishi Motors Corp., Nissan Motor Co. Ltd., Stellantis NV, Toyota Motor Corp., and Volkswagen AG are identified as major market participants. Although the growing investment in smart cities, rising investment in automotive manufacturing by member countries, and the commencement of global events such as the Dubai Expo and Fifa World Cup will offer immense growth opportunities, the shutdown of manufacturing and production units, stringent Government regulations, and the high dependency on imported vehicle parts will challenge the growth of the market participants. To make the most of the opportunities, market vendors should focus more on the growth prospects in the fast-growing segments, while maintaining their positions in the slow-growing segments.
The automotive market in GCC is segmented as below:
- Type
- Passenger Cars
- Commercial Vehicles
The demand for passenger cars in the market is growing at a faster pace. The growth can be attributed to the rising per capita income of consumers. Besides, low fuel prices and high investments in the development of road infrastructure in GCC countries have boosted the demand for comfortable passenger cars.
- Geography
- Saudi Arabia
- UAE
- Kuwait
- Others
Saudi Arabia holds the largest share of the automotive market in GCC. The high adoption of passenger cars and changing social dynamics are driving the growth of the regional market. Technavio presents a detailed picture of the market by way of study, synthesis, and summation of data from multiple sources. Our automotive market in GCC report covers the following areas:
We provide a detailed analysis of around 25 vendors operating in the automotive market in GCC. Backed with competitive intelligence and benchmarking, our research report on the automotive market in GCC is designed to provide entry support, customer profile, and M&As as well as go-to-market strategy support.
- CAGR of the market during the forecast period 2022-2026
- Detailed information on factors that will assist automotive market growth in GCC during the next five years
- Estimation of the automotive market size in GCC and its contribution to the parent market
- Predictions on upcoming trends and changes in consumer behavior
- The growth of the automotive market in the GCC
- Analysis of the market’s competitive landscape and detailed information on vendors
- Comprehensive details of factors that will challenge the growth of automotive market vendors in the GCC
- Automotive Premium Tires Market Growth, Size, Trends, Analysis Report by Type, Application, Region and Segment Forecast 2022-2026
- Automotive Four-wheel Drive Vehicle Market Growth, Size, Trends, Analysis Report by Type, Application, Region and Segment Forecast 2021-2025
|
Automotive Market in GCC: Scope |
|
|
Report Coverage |
Details |
|
Page number |
120 |
|
Base year |
2021 |
|
Forecast period |
2022-2026 |
|
Growth momentum & CAGR |
Accelerate at a CAGR of 6.74% |
|
Market growth 2022-2026 |
346.37 thousand units |
|
Market structure |
Fragmented |
|
YoY growth (%) |
5.91 |
|
Regional analysis |
Saudi Arabia |
|
Performing market contribution |
Saudi Arabia at 100% |
|
Key consumer countries |
Saudi Arabia |
|
Competitive landscape |
Leading companies, competitive strategies, consumer engagement scope |
|
Companies profiled |
BMW AG, Daimler AG, General Motors Co., Hyundai Motor Co., Kia Motors Corp., Mitsubishi Motors Corp., Nissan Motor Co. Ltd., Stellantis NV, Toyota Motor Corp., and Volkswagen AG |
|
Market Dynamics |
Parent market analysis, Market growth inducers and obstacles, Fast-growing and slow-growing segment analysis, COVID 19 impact and future consumer dynamics, and market condition analysis for the forecast period. |
|
Customization purview |
If our report has not included the data that you are looking for, you can reach out to our analysts and get segments customized. |
1. Executive Summary
2. Market Landscape
2.1 Market ecosystem
Exhibit 01: Parent market
Exhibit 02: Market Characteristics
2.2 Value Chain Analysis
Exhibit 03: Value chain analysis: Application software
2.3.1 Input
2.3.2 Software development process
2.3.3 Marketing and distribution
2.3.4 Post-selling services
Innovation
3. Market Sizing
3.1 Market definition
Exhibit 04: Offerings of vendors included in the market definition
3.2 Market segment analysis
Exhibit 05: Market segments
3.3 Market size 2019
3.4 Market outlook: Forecast for 2019 – 2024
Exhibit 06: Global – Market size and forecast 2019 – 2024 ($ million)
Exhibit 07: Global market: Year-over-year growth 2019 – 2024 (%)
4. Five Forces Analysis
4.1 Five Forces Summary
Exhibit 08: Five forces analysis 2019 & 2024
4.2 Bargaining power of buyers
Exhibit 09: Bargaining power of the buyer
4.3 Bargaining power of suppliers
Exhibit 10: Bargaining power of the supplier
4.4 Threat of new entrants
Exhibit 11: Threat of new entrants
4.5 Threat of substitutes
Exhibit 12: Threat of substitutes
4.6 Threat of rivalry
Exhibit 13: Threat of rivalry
4.7 Market condition
Exhibit 14: Market condition – Five forces 2019
5. Market Segmentation by Product
5.1 Market segments
Exhibit 15: Product – Market share 2019-2024 (%)
5.2 Comparison by Product
Exhibit 16: Comparison by Product
5.3 Application testing – Market size and forecast 2020-2025
Exhibit 17: Application testing – Market size and forecast 2020-2025 ($ million)
Exhibit 18: Application testing – Year-over-year growth 2020-2025 (%)
5.4 Product testing – Market size and forecast 2020-2025
Exhibit 19: Product testing – Market size and forecast 2020-2025 ($ million)
Exhibit 20: Product testing – Year-over-year growth 2020-2025 (%)
5.5 Market opportunity by Product
Exhibit 21: Market opportunity by Product
6. Customer landscape
Technavio’s customer landscape matrix comparing Drivers or price sensitivity, Adoption lifecycle, importance in customer price basket, Adoption rate and Key purchase criteria
Exhibit 22: Customer landscape
7. Geographic Landscape
7.1 Geographic segmentation
Exhibit 23: Market share by geography 2020-2025 (%)
7.2 Geographic comparison
Exhibit 24: Geographic comparison
7.3 North America – Market size and forecast 2020-2025
Exhibit 25: North America – Market size and forecast 2020-2025 ($ million)
Exhibit 26: North America – Year-over-year growth 2020-2025 (%)
7.4 Europe – Market size and forecast 2020-2025
Exhibit 27: Europe – Market size and forecast 2020-2025 ($ million)
Exhibit 28: Europe – Year-over-year growth 2020-2025 (%)
7.5 APAC – Market size and forecast 2020-2025
Exhibit 29: APAC – Market size and forecast 2020-2025 ($ million)
Exhibit 30: APAC – Year-over-year growth 2020-2025 (%)
7.6 South America – Market size and forecast 2020-2025
Exhibit 31: South America – Market size and forecast 2020-2025 ($ million)
Exhibit 32: South America – Year-over-year growth 2020-202 (%)
7.7 MEA – Market size and forecast 2020-2025
Exhibit 33: MEA – Market size and forecast 2020-2025 ($ million)
Exhibit 34: MEA – Year-over-year growth 2020-2025 (%)
7.8 Key leading countries
Exhibit 35: Key leading countries
7.9 Market opportunity by geography
Exhibit 36: Market opportunity by geography ($ million)
8. Drivers, Challenges, and Trends
8.1 Market Driver
8.1.1 Increasing adoption of mobile devices and applications
8.1.2 Adoption of test automation services
8.1.3 Need to ensure systems can handle extreme workloads
8.2 Market challenges
8.2.1 Easy availability of open-source stress testing tools
8.2.2 Heterogeneous test environments
8.2.3 Data quality and data management issues
Exhibit 37: Impact of drivers and challenges
8.3 Market trends
8.3.1 AI-based stress testing
8.3.2 Stress testing for CI and CD in software development processes
8.3.3 Increasing demand for outsourced testing services
9. Vendor Landscape
9.1 Vendor Overview
Exhibit 38: Vendor landscape
9.2 Landscape disruption
Exhibit 39: Landscape disruption
Exhibit 40: Industry Risk
10. Vendor Analysis
10.1 Vendors covered
Exhibit 41: Vendors covered
10.2 Market positioning of vendors
Exhibit 42: Market positioning of vendors
10.3 Accenture Plc
Exhibit 43: Accenture Plc – Overview
Exhibit 44: Accenture Plc – Business segments
Exhibit 45: Accenture Plc – Key offerings
Exhibit 46: Accenture Plc – Segment focus
10.4 Akamai Technologies Inc.
Exhibit 47: Akamai Technologies Inc. – Overview
Exhibit 48: Akamai Technologies Inc. – Business segments
Exhibit 49: Akamai Technologies Inc. – Key News
Exhibit 50: Akamai Technologies Inc. – Key offerings
Exhibit 51: Akamai Technologies Inc. – Segment focus
10.5 Capgemini SE
Exhibit 52: Capgemini SE – Overview
Exhibit 53: Capgemini SE – Business segments
Exhibit 54: Capgemini SE – Key News
Exhibit 55: Capgemini SE – Key offerings
Exhibit 56: Capgemini SE – Segment focus
10.6 Cigniti Technologies Ltd.
Exhibit 57: Cigniti Technologies Ltd. – Overview
Exhibit 58: Cigniti Technologies Ltd. – Business segments
Exhibit 59: Cigniti Technologies Ltd. – Key News
Exhibit 60: Cigniti Technologies Ltd. – Key offerings
10.7 Infosys Ltd.
Exhibit 61: Infosys Ltd. – Overview
Exhibit 62: Infosys Ltd. – Business segments
Exhibit 63: Infosys Ltd. – Key News
Exhibit 64: Infosys Ltd. – Key offerings
Exhibit 65: Infosys Ltd. – Segment focus
10.8 International Business Machines Corp.
Exhibit 66: International Business Machines Corp. – Overview
Exhibit 67: International Business Machines Corp. – Business segments
Exhibit 68: International Business Machines Corp. – Key News
Exhibit 69: International Business Machines Corp. – Key offerings
Exhibit 70: International Business Machines Corp. – Segment focus
10.9 Microsoft Corp.
Exhibit 71: Microsoft Corp. – Overview
Exhibit 72: Microsoft Corp. – Business segments
Exhibit 73: Microsoft Corp. – Key offerings
Exhibit 74: Microsoft Corp. – Segment focus
10.10 Oracle Corp.
Exhibit 75: Oracle Corp. – Overview
Exhibit 76: Oracle Corp. – Business segments
Exhibit 77: Oracle Corp. – Key offerings
Exhibit 78: Oracle Corp. – Segment focus
10.11Performance Lab US LLC
Exhibit 79: Performance Lab US LLC – Overview
Exhibit 80: Performance Lab US LLC – Product and service
Exhibit 81: Performance Lab US LLC – Key offerings
10.12 Tricentis GmbH
Exhibit 82: Tricentis GmbH – Overview
Exhibit 83: Tricentis GmbH – Product and service
Exhibit 84: Tricentis GmbH – Key News
Exhibit 85: Tricentis GmbH – Key offerings
11. Appendix
11.1 Scope of the report
11.1.1 Market definition
11.1.2 Objectives
11.1.3 Notes and caveats
11.2 Currency conversion rates for US$
Exhibit 86: Currency conversion rates for US$
11.3 Research Methodology
Exhibit 87: Research Methodology
Exhibit 88: Validation techniques employed for market sizing
Exhibit 89: Information sources
11.4 List of abbreviations
Exhibit 90: List of abbreviations
Technavio is a leading global technology research and advisory company. Their research and analysis focus on emerging market trends and provides actionable insights to help businesses identify market opportunities and develop effective strategies to optimize their market positions. With over 500 specialized analysts, Technavio’s report library consists of more than 17,000 reports and counting, covering 800 technologies, spanning across 50 countries. Their client base consists of enterprises of all sizes, including more than 100 Fortune 500 companies. This growing client base relies on Technavio’s comprehensive coverage, extensive research, and actionable market insights to identify opportunities in existing and potential markets and assess their competitive positions within changing market scenarios.
Contact
Technavio Research
Jesse Maida
Media & Marketing Executive
US: +1 844 364 1100
UK: +44 203 893 3200
Email: media@technavio.com
Website: www.technavio.com/
![]()
![]() View original content to download multimedia:https://www.prnewswire.com/news-releases/automotive-market-in-gcc–growth-accelerating-at-6-74-cagr-301606656.html
View original content to download multimedia:https://www.prnewswire.com/news-releases/automotive-market-in-gcc–growth-accelerating-at-6-74-cagr-301606656.html
SOURCE Technavio

Source link
The content is by PR Newswire. Headlines of Today Media is not responsible for the content provided or any links related to this content. Headlines of Today Media is not responsible for the correctness, topicality or the quality of the content.