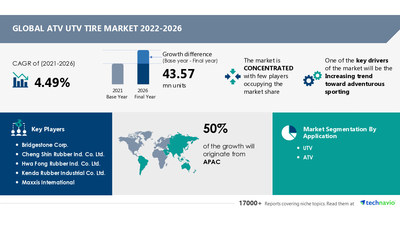
NEW YORK, Nov. 14, 2022 /PRNewswire/ — Technavio has been monitoring the ATV UTV tire market, operating under the Consumer Discretionary industry. The report estimates the market to register an incremental growth of 43.57 million units during the forecast period. The increasing trend toward adventurous sporting has been instrumental in driving the growth of the market. However, price fluctuations of rubber might hamper the market growth. Request a Free Sample Report.

Technavio categorizes the global all-terrain vehicle (ATV) and utility terrain vehicle (UTV) tire market as a part of the global tires and rubber market within the global auto components market. The parent global tires and rubber market covers products and companies engaged in the development of tires used in various types of vehicles, and rubbers that are used in tire manufacturing. Technavio calculates the global tires and rubber market based on combined revenue generated by manufacturers of tires for automobiles, commercial vehicles, off-road vehicles, heavy-duty vehicles, and motorcycles. Growth in the global tires and rubber market will be driven by the following factors:
- Tire aftermarket showcasing the higher potential
- Increasing growth in the motorcycle tires market in APAC
- Increasing adoption of alloy wheels for motorcycles
- Growing bicycle market due to changes in market dynamics
- Balancing functionalities in tire manufacturing
To unlock information about vendor drive costs and customer service, download a free sample report.
- Application
- UTV
- The ATV UTV tire market share growth by the UTV segment will be significant during the forecast period. UTV tires are more powerful and maneuverable than ATV tires, even on rough terrain and in dense forests. They also offer better performance capabilities than ATV tires. Additionally, their capacity to move light cargoes through rough terrain is being used more and more in farming and agricultural operations. As a result, it is predicted that the UTV application segment of the worldwide ATV and UTV market will experience rapid expansion during the forecast period.
- ATV
- Geography
- APAC
- APAC will account for 50% of market growth. The top three markets in APAC for utility and all-terrain vehicle tires are China, Japan, and India. This region’s market will expand more quickly than those in other areas. The expansion of the ATV UTV tire market in APAC would be aided by the rising popularity of off-road vehicle championships as a viewing source.
- Europe
- North America
- Middle East and Africa
- South America
To know additional highlights and key points on various market segments and their impact in coming years, Buy a Sample Report.
Technavio presents a detailed picture of the market by the way of study, synthesis, and summation of data from multiple sources. The ATV UTV tire market report covers the following areas:
This study identifies the increasing application in defense and military as one of the prime reasons driving the ATV UTV Tire Market growth during the next few years.
- CAGR of the market during the forecast period 2022-2026
- Detailed information on factors that will assist ATV UTV tire market growth during the next five years
- Estimation of the ATV UTV tire market size and its contribution to the parent market
- Predictions on upcoming trends and changes in consumer behavior
- The growth of the ATV UTV tire market
- Analysis of the market’s competitive landscape and detailed information on vendors
- Comprehensive details of factors that will challenge the growth of the ATV UTV tire market, vendors
Get lifetime access to our Technavio Insights! Subscribe to our “Basic Plan” billed annually at USD 5000.
Automotive Premium Tires Market Growth, Size, Trends, Analysis Report by Type, Application, Region and Segment Forecast 2022-2026: The report extensively covers automotive premium tires market segmentation by end-user (replacement and OEM) and geography (North America, APAC, Europe, Middle East and Africa, and South America).
Automotive Retreaded Tires Market Growth, Size, Trends, Analysis Report by Type, Application, Region and Segment Forecast 2022-2026: The report extensively covers automotive retreaded tires market segmentation by product (precure and mold cure) and geography (North America, APAC, Europe, South America, and Middle East and Africa).
|
ATV UTV Tire Market Scope |
|
|
Report Coverage |
Details |
|
Page number |
120 |
|
Base year |
2021 |
|
Forecast period |
2022-2026 |
|
Growth momentum & CAGR |
Decelerate at a CAGR of 4.49% |
|
Market growth 2022-2026 |
43.57 mn units |
|
Market structure |
Concentrated |
|
YoY growth (%) |
4.91 |
|
Regional analysis |
APAC, Europe, North America, Middle East and Africa, and South America |
|
Performing market contribution |
APAC at 50% |
|
Key consumer countries |
US, China, Japan, India, and Germany |
|
Competitive landscape |
Leading companies, competitive strategies, consumer engagement scope |
|
Companies profiled |
Bridgestone Corp., Cheng Shin Rubber Ind. Co. Ltd., Hwa Fong Rubber Ind. Co. Ltd., Kenda Rubber Industrial Co. Ltd., Maxxis International, Michelin Group, OTR Wheel Engineering Inc., Sedona Tire and Wheel, The Carlstar Group LLC, TIANJIN WANDA TYRE GROUP Co. Ltd., Titan International Inc., and Toyo Tire Corp. |
|
Market Dynamics |
Parent market analysis, Market growth inducers and obstacles, Fast-growing and slow-growing segment analysis, COVID-19 impact and future consumer dynamics, and market condition analysis for the forecast period. |
|
Customization purview |
If our report has not included the data that you are looking for, you can reach out to our analysts and get segments customized. |
1 Executive Summary
- 1.1 Market Overview
- Exhibit 01: Executive Summary – Chart on Market Overview
- Exhibit 02: Executive Summary – Data Table on Market Overview
- Exhibit 03: Executive Summary – Chart on Global Market Characteristics
- Exhibit 04: Executive Summary – Chart on Market by Geography
- Exhibit 05: Executive Summary – Chart on Market Segmentation by Application
- Exhibit 06: Executive Summary – Chart on Incremental Growth
- Exhibit 07: Executive Summary – Data Table on Incremental Growth
- Exhibit 08: Executive Summary – Chart on Vendor Market Positioning
2 Market Landscape
- 2.1 Market ecosystem
- Exhibit 09: Parent market
- Exhibit 10: Market Characteristics
3 Market Sizing
- 3.1 Market definition
- Exhibit 11: Offerings of vendors included in the market definition
- 3.2 Market segment analysis
- Exhibit 12: Market segments
- 3.3 Market size 2021
- 3.4 Market outlook: Forecast for 2021-2026
- Exhibit 13: Chart on Global – Market size and forecast 2021-2026 (million units)
- Exhibit 14: Data Table on Global – Market size and forecast 2021-2026 (million units)
- Exhibit 15: Chart on Global Market- Year-over-year growth 2021-2026 (%)
- Exhibit 16: Data Table on Global Market- Year-over-year growth 2021-2026 (%)
4 Five Forces Analysis
- 4.1 Five forces summary
- Exhibit 17: Five forces analysis – Comparison between 2021 and 2026
- 4.2 Bargaining power of buyers
- Exhibit 18: Chart on Bargaining power of buyers – Impact of key factors 2021 and 2026
- 4.3 Bargaining power of suppliers
- Exhibit 19: Bargaining power of suppliers – Impact of key factors in 2021 and 2026
- 4.4 Threat of new entrants
- Exhibit 20: Threat of new entrants – Impact of key factors in 2021 and 2026
- 4.5 Threat of substitutes
- Exhibit 21: Threat of substitutes – Impact of key factors in 2021 and 2026
- 4.6 Threat of rivalry
- Exhibit 22: Threat of rivalry – Impact of key factors in 2021 and 2026
- 4.7 Market condition
- Exhibit 23: Chart on Market condition – Five forces 2021 and 2026
5 Market Segmentation by Application
- 5.1 Market segments
- Exhibit 24: Chart on Application – Market share 2021-2026 (%)
- Exhibit 25: Data Table on Application – Market share 2021-2026 (%)
- 5.2 Comparison by Application
- Exhibit 26: Chart on Comparison by Application
- Exhibit 27: Data Table on Comparison by Application
- 5.3 UTV – Market size and forecast 2021-2026
- Exhibit 28: Chart on UTV – Market size and forecast 2021-2026 (million units)
- Exhibit 29: Data Table on UTV – Market size and forecast 2021-2026 (million units)
- Exhibit 30: Chart on UTV – Year-over-year growth 2021-2026 (%)
- Exhibit 31: Data Table on UTV – Year-over-year growth 2021-2026 (%)
- 5.4 ATV – Market size and forecast 2021-2026
- Exhibit 32: Chart on ATV – Market size and forecast 2021-2026 (million units)
- Exhibit 33: Data Table on ATV – Market size and forecast 2021-2026 (million units)
- Exhibit 34: Chart on ATV – Year-over-year growth 2021-2026 (%)
- Exhibit 35: Data Table on ATV – Year-over-year growth 2021-2026 (%)
- 5.5 Market opportunity by Application
- Exhibit 36: Market opportunity by Application (million units)
6 Customer Landscape
- 6.1 Customer landscape overview
- Exhibit 37: Analysis of price sensitivity, lifecycle, customer purchase basket, adoption rates, and purchase criteria
7 Geographic Landscape
- 7.1 Geographic segmentation
- Exhibit 38: Chart on Market share by geography 2021-2026 (%)
- Exhibit 39: Data Table on Market share by geography 2021-2026 (%)
- 7.2 Geographic comparison
- Exhibit 40: Chart on Geographic comparison
- Exhibit 41: Data Table on Geographic comparison
- 7.3 APAC – Market size and forecast 2021-2026
- Exhibit 42: Chart on APAC – Market size and forecast 2021-2026 (million units)
- Exhibit 43: Data Table on APAC – Market size and forecast 2021-2026 (million units)
- Exhibit 44: Chart on APAC – Year-over-year growth 2021-2026 (%)
- Exhibit 45: Data Table on APAC – Year-over-year growth 2021-2026 (%)
- 7.4 Europe – Market size and forecast 2021-2026
- Exhibit 46: Chart on Europe – Market size and forecast 2021-2026 (million units)
- Exhibit 47: Data Table on Europe – Market size and forecast 2021-2026 (million units)
- Exhibit 48: Chart on Europe – Year-over-year growth 2021-2026 (%)
- Exhibit 49: Data Table on Europe – Year-over-year growth 2021-2026 (%)
- 7.5 North America – Market size and forecast 2021-2026
- Exhibit 50: Chart on North America – Market size and forecast 2021-2026 (million units)
- Exhibit 51: Data Table on North America – Market size and forecast 2021-2026 (million units)
- Exhibit 52: Chart on North America – Year-over-year growth 2021-2026 (%)
- Exhibit 53: Data Table on North America – Year-over-year growth 2021-2026 (%)
- 7.6 Middle East and Africa – Market size and forecast 2021-2026
- Exhibit 54: Chart on Middle East and Africa – Market size and forecast 2021-2026 (million units)
- Exhibit 55: Data Table on Middle East and Africa – Market size and forecast 2021-2026 (million units)
- Exhibit 56: Chart on Middle East and Africa – Year-over-year growth 2021-2026 (%)
- Exhibit 57: Data Table on Middle East and Africa – Year-over-year growth 2021-2026 (%)
- 7.7 South America – Market size and forecast 2021-2026
- Exhibit 58: Chart on South America – Market size and forecast 2021-2026 (million units)
- Exhibit 59: Data Table on South America – Market size and forecast 2021-2026 (million units)
- Exhibit 60: Chart on South America – Year-over-year growth 2021-2026 (%)
- Exhibit 61: Data Table on South America – Year-over-year growth 2021-2026 (%)
- 7.8 China – Market size and forecast 2021-2026
- Exhibit 62: Chart on China – Market size and forecast 2021-2026 (million units)
- Exhibit 63: Data Table on China – Market size and forecast 2021-2026 (million units)
- Exhibit 64: Chart on China – Year-over-year growth 2021-2026 (%)
- Exhibit 65: Data Table on China – Year-over-year growth 2021-2026 (%)
- 7.9 US – Market size and forecast 2021-2026
- Exhibit 66: Chart on US – Market size and forecast 2021-2026 (million units)
- Exhibit 67: Data Table on US – Market size and forecast 2021-2026 (million units)
- Exhibit 68: Chart on US – Year-over-year growth 2021-2026 (%)
- Exhibit 69: Data Table on US – Year-over-year growth 2021-2026 (%)
- 7.10 Germany – Market size and forecast 2021-2026
- Exhibit 70: Chart on Germany – Market size and forecast 2021-2026 (million units)
- Exhibit 71: Data Table on Germany – Market size and forecast 2021-2026 (million units)
- Exhibit 72: Chart on Germany – Year-over-year growth 2021-2026 (%)
- Exhibit 73: Data Table on Germany – Year-over-year growth 2021-2026 (%)
- 7.11 Japan – Market size and forecast 2021-2026
- Exhibit 74: Chart on Japan – Market size and forecast 2021-2026 (million units)
- Exhibit 75: Data Table on Japan – Market size and forecast 2021-2026 (million units)
- Exhibit 76: Chart on Japan – Year-over-year growth 2021-2026 (%)
- Exhibit 77: Data Table on Japan – Year-over-year growth 2021-2026 (%)
- 7.12 India – Market size and forecast 2021-2026
- Exhibit 78: Chart on India – Market size and forecast 2021-2026 (million units)
- Exhibit 79: Data Table on India – Market size and forecast 2021-2026 (million units)
- Exhibit 80: Chart on India – Year-over-year growth 2021-2026 (%)
- Exhibit 81: Data Table on India – Year-over-year growth 2021-2026 (%)
- 7.13 Market opportunity by geography
- Exhibit 82: Market opportunity by geography (million units)
8 Drivers, Challenges, and Trends
- 8.1 Market drivers
- 8.2 Market challenges
- 8.3 Impact of drivers and challenges
- Exhibit 83: Impact of drivers and challenges in 2021 and 2026
- 8.4 Market trends
9 Vendor Landscape
- 9.1 Overview
- 9.2 Vendor landscape
- Exhibit 84: Overview on Criticality of inputs and Factors of differentiation
- 9.3 Landscape disruption
- Exhibit 85: Overview on factors of disruption
- 9.4 Industry risks
- Exhibit 86: Impact of key risks on business
10 Vendor Analysis
- 10.1 Vendors covered
- Exhibit 87: Vendors covered
- 10.2 Market positioning of vendors
- Exhibit 88: Matrix on vendor position and classification
- 10.3 Bridgestone Corp.
- Exhibit 89: Bridgestone Corp. – Overview
- Exhibit 90: Bridgestone Corp. – Business segments
- Exhibit 91: Bridgestone Corp. – Key news
- Exhibit 92: Bridgestone Corp. – Key offerings
- Exhibit 93: Bridgestone Corp. – Segment focus
- 10.4 Hwa Fong Rubber Ind. Co. Ltd.
- Exhibit 94: Hwa Fong Rubber Ind. Co. Ltd. – Overview
- Exhibit 95: Hwa Fong Rubber Ind. Co. Ltd. – Product / Service
- Exhibit 96: Hwa Fong Rubber Ind. Co. Ltd. – Key offerings
- 10.5 Kenda Rubber Industrial Co. Ltd.
- Exhibit 97: Kenda Rubber Industrial Co. Ltd. – Overview
- Exhibit 98: Kenda Rubber Industrial Co. Ltd. – Product / Service
- Exhibit 99: Kenda Rubber Industrial Co. Ltd. – Key offerings
- 10.6 Maxxis International
- Exhibit 100: Maxxis International – Overview
- Exhibit 101: Maxxis International – Product / Service
- Exhibit 102: Maxxis International – Key offerings
- 10.7 Michelin Group
- Exhibit 103: Michelin Group – Overview
- Exhibit 104: Michelin Group – Business segments
- Exhibit 105: Michelin Group – Key news
- Exhibit 106: Michelin Group – Key offerings
- Exhibit 107: Michelin Group – Segment focus
- 10.8 OTR Wheel Engineering Inc.
- Exhibit 108: OTR Wheel Engineering Inc. – Overview
- Exhibit 109: OTR Wheel Engineering Inc. – Product / Service
- Exhibit 110: OTR Wheel Engineering Inc. – Key offerings
- 10.9 Sedona Tire and Wheel
- Exhibit 111: Sedona Tire and Wheel – Overview
- Exhibit 112: Sedona Tire and Wheel – Product / Service
- Exhibit 113: Sedona Tire and Wheel – Key offerings
- 10.10 The Carlstar Group LLC
- Exhibit 114: The Carlstar Group LLC – Overview
- Exhibit 115: The Carlstar Group LLC – Product / Service
- Exhibit 116: The Carlstar Group LLC – Key offerings
- 10.11 Titan International Inc.
- Exhibit 117: Titan International Inc. – Overview
- Exhibit 118: Titan International Inc. – Business segments
- Exhibit 119: Titan International Inc. – Key offerings
- Exhibit 120: Titan International Inc. – Segment focus
- 10.12 Toyo Tire Corp.
- Exhibit 121: Toyo Tire Corp. – Overview
- Exhibit 122: Toyo Tire Corp. – Business segments
- Exhibit 123: Toyo Tire Corp. – Key news
- Exhibit 124: Toyo Tire Corp. – Key offerings
- Exhibit 125: Toyo Tire Corp. – Segment focus
11 Appendix
- 11.1 Scope of the report
- 11.2 Inclusions and exclusions checklist
- Exhibit 126: Inclusions checklist
- Exhibit 127: Exclusions checklist
- 11.3 Currency conversion rates for US$
- Exhibit 128: Currency conversion rates for US$
- 11.4 Research methodology
- Exhibit 129: Research methodology
- Exhibit 130: Validation techniques employed for market sizing
- Exhibit 131: Information sources
- 11.5 List of abbreviations
- Exhibit 132: List of abbreviations
- bicycle market due to changes in market dynamics: Increase in urbanization, rising disposable income, increased traffic and congestion, rising health consciousness and environmental concerns, and a significant increase in the fuel prices have driven the change in preference toward transportation mode among the people for a short-distance commute. In the past few years, fuel prices have increased significantly, which is expected to fluctuate, resulting in customers shifting their preferences to bicycles as a convenient mode of commute. Additionally, with the continuous rise in fuel prices, the demand for battery-powered bicycles and mountain bicycles has increased. Mountain bicycles are equipped with gears and suspension, which help in managing speeds better and make them easier to ride through mountain areas, overpasses, and rough roads.
Technavio is a leading global technology research and advisory company. Their research and analysis focus on emerging market trends and provides actionable insights to help businesses identify market opportunities and develop effective strategies to optimize their market positions. With over 500 specialized analysts, Technavio’s report library consists of more than 17,000 reports and counting, covering 800 technologies, spanning across 50 countries. Their client base consists of enterprises of all sizes, including more than 100 Fortune 500 companies. This growing client base relies on Technavio’s comprehensive coverage, extensive research, and actionable market insights to identify opportunities in existing and potential markets and assess their competitive positions within changing market scenarios.
Contact
Technavio Research
Jesse Maida
Media & Marketing Executive
US: +1 844 364 1100
UK: +44 203 893 3200
Email: media@technavio.com
Website: www.technavio.com/
![]()
![]() View original content to download multimedia:https://www.prnewswire.com/news-releases/atv-utv-tire-market-to-grow-by-43-57-mn-units-by-2026–market-segmentation-by-application-and-geography—technavio-301674690.html
View original content to download multimedia:https://www.prnewswire.com/news-releases/atv-utv-tire-market-to-grow-by-43-57-mn-units-by-2026–market-segmentation-by-application-and-geography—technavio-301674690.html
SOURCE Technavio

Source link
The content is by PR Newswire. Headlines of Today Media is not responsible for the content provided or any links related to this content. Headlines of Today Media is not responsible for the correctness, topicality or the quality of the content.