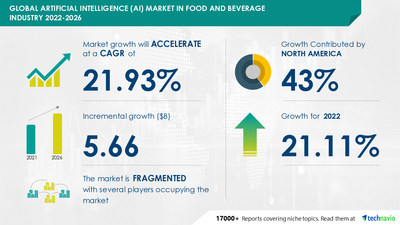
NEW YORK, May 9, 2022 /PRNewswire/ — The artificial intelligence (AI) market in food and beverage industry will be led by North America. The region will account for 43% of the market’s growth during the forecast period. The market size is anticipated to grow by USD 5.66 billion from 2021 to 2026. The growth momentum of the market will accelerate at a CAGR of 21.93%. This growth can be attributed to the rising demand for automation to improve productivity. However, lack of skilled personnel can hamper the growth of the market during the next few years.
 Market in Food and Beverage (F&B) Industry Market by Application and Geography - Forecast and Analysis 2022-2026")
Use our analysis and insights for effective decision making. Download a Sample Report
Read the report with TOC on “Artificial Intelligence (AI) Market In Food And Beverage Industry Market Analysis Report by Application (Transportation and logistics , Production planning, Quality control, and Others) and Geography (North America, Europe, APAC, South America, and Middle East and Africa) Forecasts, 2022-2026″. View our Report Snapshot
Major Five Artificial Intelligence (AI) in Food and Beverage Industry Companies: Key Offerings
- ABB Ltd. – The company offers artificial intelligence in food and beverage industry that provides expertise in every segment, from sugar production to beverage bottling.
- Aboard Software – The company offers artificial intelligence in food and beverage industry that includes enterprise resource planning, conceptual model-based development, robotic components, and customer relationship management.
- Ailytic Holdings Pty Ltd. – The company offers artificial intelligence in food and beverage industry that helps to make intelligent decisions about manufacturing operations with powerful, smart, and easy-to-use manufacturing software.
- Duravant LLC – The company offers artificial intelligence in food and beverage industry that provides clearer sensor images and enhanced detection of product defects and double the life of previous generation LEDs, reducing maintenance and operating costs.
- Honeywell International Inc. – The company offers artificial intelligence in food and beverage industry that improves efficiency, safeguards public health, increases customer satisfaction, and provides the means to comply with government mandates.
Get lifetime access to our Technavio Insights! Subscribe to our “Basic Plan” billed annually at USD 5000
Artificial Intelligence (AI) Market In Food And Beverage Industry Market Application Outlook (Revenue, USD bn, 2021-2026)
- Transportation and logistics – size and forecast 2021-2026
- Production planning – size and forecast 2021-2026
- Quality control – size and forecast 2021-2026
- Others – size and forecast 2021-2026
Artificial Intelligence (AI) Market In Food And Beverage Industry Market Geography Outlook (Revenue, USD bn, 2021-2026)
- North America – size and forecast 2021-2026
- Europe – size and forecast 2021-2026
- APAC – size and forecast 2021-2026
- South America – size and forecast 2021-2026
- Middle East and Africa – size and forecast 2021-2026
Do you want to learn about the contribution of each segment of the market? View an Exclusive Sample Report
Regional Analysis
North America will have the highest market share growth during the forecast period. The increase in the adoption of advanced technologies with greater computing power to improve decision-making in food and beverage firms will drive the artificial intelligence (AI) market in food and beverage industry growth in North America during the forecast period. Market growth in this region will be slower than the growth of the market in the Middle East and Africa. The US is a key country for the artificial intelligence (AI) market in food and beverage industry in North America.
Related Reports:
Compensation Software Market by Deployment and Geography – Forecast and Analysis 2022-2026
Video Managed Services Market by End-user and Geography – Forecast and Analysis 2022-2026
|
Artificial intelligence (AI) Market Scope in Food and Beverage Industry |
|
|
Report Coverage |
Details |
|
Page number |
120 |
|
Base year |
2021 |
|
Forecast period |
2022-2026 |
|
Growth momentum & CAGR |
Accelerate at a CAGR of 21.93% |
|
Market growth 2022-2026 |
USD 5.66 billion |
|
Market structure |
Fragmented |
|
YoY growth (%) |
21.11 |
|
Regional analysis |
North America, Europe, APAC, South America, and Middle East and Africa |
|
Performing market contribution |
North America at 43% |
|
Key consumer countries |
US, China, Japan, Germany, and UK |
|
Competitive landscape |
Leading companies, Competitive strategies, Consumer engagement scope |
|
Key companies profiled |
ABB Ltd., Aboard Software, AGCO Corp., Ailytic Holdings Pty Ltd., Analytical Flavor Systems inc., Buhler AG, Compac Sorting Equipment, Duravant LLC, Foodable Network LLC, Honeywell international inc., Martec Of Whitwell Ltd., Ravenwood Packaging Ltd., Raytec Vision S.p.A., Rockwell Automation inc., Sesotec GmbH, Siemens AG, Sight Machine, and The Not Co. inc. |
|
Market dynamics |
Parent market analysis, Market growth inducers and obstacles, Fast-growing and slow-growing segment analysis, COVID 19 impact and recovery analysis and future consumer dynamics, Market condition analysis for forecast period |
|
Customization purview |
If our report has not included the data that you are looking for, you can reach out to our analysts and get segments customized. |
Table of Contents
1. Executive Summary
1.1 Market Overview
Exhibit 01: Executive Summary – Chart on Market Overview
Exhibit 02: Executive Summary – Data Table on Market Overview
Exhibit 03: Executive Summary – Chart on Global Market Characteristics
Exhibit 04: Executive Summary – Chart on Market by Geography
Exhibit 05: Executive Summary – Chart on Market Segmentation by Application
Exhibit 06: Executive Summary – Chart on Incremental Growth
Exhibit 07: Executive Summary – Data Table on Incremental Growth
Exhibit 08: Executive Summary – Chart on Vendor Market Positioning
2. Market Landscape
2.1 Market ecosystem
Exhibit 09: Parent market
Exhibit 10: Market characteristics
3. Market Sizing
3.1 Market definition
Exhibit 11: Offerings of vendors included in the market definition
3.2 Market segment analysis
Exhibit 12: Market segments
3.3 Market size 2021
3.4 Market outlook: Forecast for 2021 – 2026
Exhibit 13: Chart on Global – Market size and forecast 2021-2026 ($ million)
Exhibit 14: Data Table on Global – Market size and forecast 2021-2026 ($ million)
Exhibit 15: Chart on Global Market: Year-over-year growth 2021-2026 (%)
Exhibit 16: Data Table on Global Market: Year-over-year growth 2021-2026 (%)
4. Five Forces Analysis
4.1 Five Forces Summary
Exhibit 17: Five forces analysis – Comparison between 2021 and 2026
4.2 Bargaining power of buyers
Exhibit 18: Bargaining power of buyers – Impact of key factors in 2021 and 2026
4.3 Bargaining power of suppliers
Exhibit 19: Bargaining power of suppliers – Impact of key factors in 2021 and 2026
4.4 Threat of new entrants
Exhibit 20: Threat of new entrants – Impact of key factors in 2021 and 2026
4.5 Threat of substitutes
Exhibit 21: Threat of substitutes – Impact of key factors in 2021 and 2026
4.6 Threat of rivalry
Exhibit 22: Threat of rivalry – Impact of key factors in 2021 and 2026
4.7 Market condition
Exhibit 23: Chart on Market condition – Five forces 2021 and 2026
5 Market Segmentation by Application
5.1 Market segments
Exhibit 24: Chart on Application – Market share 2021-2026 (%)
Exhibit 25: Data Table on Application – Market share 2021-2026 (%)
5.2 Comparison by Application
Exhibit 26: Chart on Comparison by Application
Exhibit 27: Data Table on Comparison by Application
5.3 Transportation and logistics – Market size and forecast 2021-2026
Exhibit 28: Chart on Transportation and logistics – Market size and forecast 2021-2026 ($ million)
Exhibit 29: Data Table on Transportation and logistics – Market size and forecast 2021-2026 ($ million)
Exhibit 30: Chart on Transportation and logistics – Year-over-year growth 2021-2026 (%)
Exhibit 31: Data Table on Transportation and logistics – Year-over-year growth 2021-2026 (%)
5.4 Production planning – Market size and forecast 2021-2026
Exhibit 32: Chart on Production planning – Market size and forecast 2021-2026 ($ million)
Exhibit 33: Data Table on Production planning – Market size and forecast 2021-2026 ($ million)
Exhibit 34: Chart on Production planning – Year-over-year growth 2021-2026 (%)
Exhibit 35: Data Table on Production planning – Year-over-year growth 2021-2026 (%)
5.5 Quality control – Market size and forecast 2021-2026
Exhibit 36: Chart on Quality control – Market size and forecast 2021-2026 ($ million)
Exhibit 37: Data Table on Quality control – Market size and forecast 2021-2026 ($ million)
Exhibit 38: Chart on Quality control – Year-over-year growth 2021-2026 (%)
Exhibit 39: Data Table on Quality control – Year-over-year growth 2021-2026 (%)
5.6 Others – Market size and forecast 2021-2026
Exhibit 40: Chart on Others – Market size and forecast 2021-2026 ($ million)
Exhibit 41: Data Table on Others – Market size and forecast 2021-2026 ($ million)
Exhibit 42: Chart on Others – Year-over-year growth 2021-2026 (%)
Exhibit 43: Data Table on Others – Year-over-year growth 2021-2026 (%)
5.7 Market opportunity by Application
Exhibit 44: Market opportunity by Application ($ million)
6. Customer landscape
6.1 Customer landscape overview
Technavio’s customer landscape matrix comparing Drivers or price sensitivity, Adoption lifecycle, importance in customer price basket, Adoption rate and Key purchase criteria
Exhibit 45: Analysis of price sensitivity, lifecycle, customer purchase basket, adoption rates, and purchase criteria
7. Geographic Landscape
7.1 Geographic segmentation
Exhibit 46: Chart on Market share by geography 2021-2026 (%)
Exhibit 47: Data Table on Market share by geography 2021-2026 (%)
7.2 Geographic comparison
Exhibit 48: Chart on Geographic comparison
Exhibit 49: Data Table on Geographic comparison
7.3 North America – Market size and forecast 2021-2026
Exhibit 50: Chart on North America – Market size and forecast 2021-2026 ($ million)
Exhibit 51: Data Table on North America – Market size and forecast 2021-2026 ($ million)
Exhibit 52: Chart on North America – Year-over-year growth 2021-2026 (%)
Exhibit 53: Data Table on North America – Year-over-year growth 2021-2026 (%)
7.4 Europe – Market size and forecast 2021-2026
Exhibit 54: Chart on Europe – Market size and forecast 2021-2026 ($ million)
Exhibit 55: Data Table on Europe – Market size and forecast 2021-2026 ($ million)
Exhibit 56: Chart on Europe – Year-over-year growth 2021-2026 (%)
Exhibit 57: Data Table on Europe – Year-over-year growth 2021-2026 (%)
7.5 APAC – Market size and forecast 2021-2026
Exhibit 58: Chart on APAC – Market size and forecast 2021-2026 ($ million)
Exhibit 59: Data Table on APAC – Market size and forecast 2021-2026 ($ million)
Exhibit 60: Chart on APAC – Year-over-year growth 2021-2026 (%)
Exhibit 61: Data Table on APAC – Year-over-year growth 2021-2026 (%)
7.6 South America – Market size and forecast 2021-2026
Exhibit 62: Chart on South America – Market size and forecast 2021-2026 ($ million)
Exhibit 63: Data Table on South America – Market size and forecast 2021-2026 ($ million)
Exhibit 64: Chart on South America – Year-over-year growth 2021-2026 (%)
Exhibit 65: Data Table on South America – Year-over-year growth 2021-2026 (%)
7.7 Middle East and Africa – Market size and forecast 2021-2026
Exhibit 66: Chart on Middle East and Africa – Market size and forecast 2021-2026 ($ million)
Exhibit 67: Data Table on Middle East and Africa – Market size and forecast 2021-2026 ($ million)
Exhibit 68: Chart on Middle East and Africa – Year-over-year growth 2021-2026 (%)
Exhibit 69: Data Table on Middle East and Africa – Year-over-year growth 2021-2026 (%)
7.8 US – Market size and forecast 2021-2026
Exhibit 70: Chart on US – Market size and forecast 2021-2026 ($ million)
Exhibit 71: Data Table on US – Market size and forecast 2021-2026 ($ million)
Exhibit 72: Chart on US – Year-over-year growth 2021-2026 (%)
Exhibit 73: Data Table on US – Year-over-year growth 2021-2026 (%)
7.9 China – Market size and forecast 2021-2026
Exhibit 74: Chart on China – Market size and forecast 2021-2026 ($ million)
Exhibit 75: Data Table on China – Market size and forecast 2021-2026 ($ million)
Exhibit 76: Chart on China – Year-over-year growth 2021-2026 (%)
Exhibit 77: Data Table on China – Year-over-year growth 2021-2026 (%)
7.10 UK – Market size and forecast 2021-2026
Exhibit 78: Chart on UK – Market size and forecast 2021-2026 ($ million)
Exhibit 79: Data Table on UK – Market size and forecast 2021-2026 ($ million)
Exhibit 80: Chart on UK – Year-over-year growth 2021-2026 (%)
Exhibit 81: Data Table on UK – Year-over-year growth 2021-2026 (%)
7.11 Germany – Market size and forecast 2021-2026
Exhibit 82: Chart on Germany – Market size and forecast 2021-2026 ($ million)
Exhibit 83: Data Table on Germany – Market size and forecast 2021-2026 ($ million)
Exhibit 84: Chart on Germany – Year-over-year growth 2021-2026 (%)
Exhibit 85: Data Table on Germany – Year-over-year growth 2021-2026 (%)
7.12 Market opportunity by geography
Exhibit 86: Market opportunity by geography ($ million)
8. Drivers, Challenges, and Trends
8.1 Market drivers
8.1.1 Rising demand for automation to improve productivity
8.1.2 Regulations to improve food safety
8.1.3 Evolving industrial IoT and big data integration
8.2 Market challenges
8.2.1 Lack of skilled personnel
8.2.2 Limited automation in the food and beverage industry in developing countries
8.2.3 Security issues
8.3 Impact of drivers and challenges
Exhibit 87: Impact of drivers and challenges in 2021 and 2026
8.4 Market trends
8.4.1 Emergence of IIoT
8.4.2 Technology innovations in the market
8.4.3 Advances in AI technology
9. Vendor Landscape
9.1 Overview
9.2 Vendor landscape
Exhibit 88: Overview on Criticality of inputs and Factors of differentiation
The potential for the disruption of the market landscape was moderate in 2020, and its threat is expected to remain unchanged by 2025.
9.3 Landscape disruption
Exhibit 89: Overview on factors of disruption
9.4 Industry risks
Exhibit 90: Impact of key risks on business
10. Vendor Analysis
10.1 Vendors covered
Exhibit 91: Vendors covered
10.2 Market positioning of vendors
Exhibit 92: Matrix on vendor position and classification
10.3 ABB Ltd.
Exhibit 93: ABB Ltd. – Overview
Exhibit 94: ABB Ltd. – Business segments
Exhibit 95: ABB Ltd. – Key news
Exhibit 96: ABB Ltd. – Key offerings
Exhibit 97: ABB Ltd. – Segment focus
10.4 Aboard Software
Exhibit 98: Aboard Software – Overview
Exhibit 99: Aboard Software – Product / Service
Exhibit 100: Aboard Software – Key offerings
10.5 Ailytic Holdings Pty Ltd.
Exhibit 101: Ailytic Holdings Pty Ltd. – Overview
Exhibit 102: Ailytic Holdings Pty Ltd. – Product / Service
Exhibit 103: Ailytic Holdings Pty Ltd. – Key offerings
10.6 Analytical Flavor Systems Inc.
Exhibit 104: Analytical Flavor Systems Inc. – Overview
Exhibit 105: Analytical Flavor Systems Inc. – Product / Service
Exhibit 106: Analytical Flavor Systems Inc. – Key offerings
10.7 Duravant LLC
Exhibit 107: Duravant LLC – Overview
Exhibit 108: Duravant LLC – Product / Service
Exhibit 109: Duravant LLC – Key offerings
10.8 Honeywell International Inc.
Exhibit 110: Honeywell International Inc. – Overview
Exhibit 111: Honeywell International Inc. – Business segments
Exhibit 112: Honeywell International Inc. – Key news
Exhibit 113: Honeywell International Inc. – Key offerings
Exhibit 114: Honeywell International Inc. – Segment focus
10.9 Martec Of Whitwell Ltd.
Exhibit 115: Martec Of Whitwell Ltd. – Overview
Exhibit 116: Martec Of Whitwell Ltd. – Product / Service
Exhibit 117: Martec Of Whitwell Ltd. – Key offerings
10.10 Raytec Vision S.p.A.
Exhibit 118: Raytec Vision S.p.A. – Overview
Exhibit 119: Raytec Vision S.p.A. – Product / Service
Exhibit 120: Raytec Vision S.p.A. – Key offerings
10.11 Rockwell Automation Inc.
Exhibit 121: Rockwell Automation Inc. – Overview
Exhibit 122: Rockwell Automation Inc. – Business segments
Exhibit 123: Rockwell Automation Inc. – Key news
Exhibit 124: Rockwell Automation Inc. – Key offerings
Exhibit 125: Rockwell Automation Inc. – Segment focus
About Technavio
Technavio is a leading global technology research and advisory company. Their research and analysis focus on emerging market trends and provide actionable insights to help businesses identify market opportunities and develop effective strategies to optimize their market positions.
With over 500 specialized analysts, Technavio’s report library consists of more than 17,000 reports and counting, covering 800 technologies, spanning across 50 countries. Their client base consists of enterprises of all sizes, including more than 100 Fortune 500 companies. This growing client base relies on Technavio’s comprehensive coverage, extensive research, and actionable market insights to identify opportunities in existing and potential markets and assess their competitive positions within changing market scenarios.
Contacts
Technavio Research
Jesse Maida
Media & Marketing Executive
US: +1 844 364 1100
UK: +44 203 893 3200
Email: media@technavio.com
Website: www.technavio.com/
![]()
![]() View original content to download multimedia:https://www.prnewswire.com/news-releases/artificial-intelligence-ai-market-size-in-food-and-beverage-industry-to-grow-by-usd-5-66-bn-abb-ltd-and-aboard-software-among-key-vendors–technavio-301541741.html
View original content to download multimedia:https://www.prnewswire.com/news-releases/artificial-intelligence-ai-market-size-in-food-and-beverage-industry-to-grow-by-usd-5-66-bn-abb-ltd-and-aboard-software-among-key-vendors–technavio-301541741.html
SOURCE Technavio

Source link
The content is by PR Newswire. Headlines of Today Media is not responsible for the content provided or any links related to this content. Headlines of Today Media is not responsible for the correctness, topicality or the quality of the content.