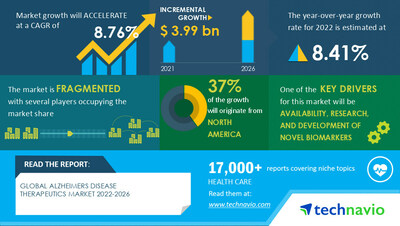
NEW YORK, Feb. 8, 2023 /PRNewswire/ — The Alzheimer’s Disease Therapeutics Market by Drug Class and Geography – Forecast and Analysis 2022-2026 report has been published by Technavio. Market size is forecast to grow by USD 3.99 billion between 2021 and 2026 at a CAGR of 8.76%. The report provides a comprehensive analysis of growth opportunities at regional levels, new product launches, the latest trends, and the post-pandemic recovery of the global market. Download A PDF Sample Report

Regional analysis
By region, the global alzheimers disease therapeutics market is segmented into North America, Europe, Asia, and Rest of World (ROW). North America will account for 37% of market growth during the forecast period. The increasing funding for the development of novel therapeutics to treat Alzheimer’s disease will facilitate the AD therapeutics market growth in North America over the forecast period. Buy the report
Company profiles
The alzheimers disease therapeutics market report includes information on the key products and recent developments of leading vendors, including:
- AbbVie Inc. – The company offers Alzheimer disease therapeutics products such as NAMENDA XR.
- Aurobindo Pharma Ltd. – The company offers Alzheimer disease therapeutics products such as Galantamine Tablets USP 4mg, 8mg and 12mg.
- Eisai Co. Ltd. – The company offers Alzheimer disease therapeutics products such as ADUHELM.
Market dynamics
The market is driven by factors such as availability, research, and development of novel biomarkers, increasing awareness of alzheimers disease, and the strong pipeline coupled with approval of therapeutics. However, the high cost of therapeutics development might hamper the market growth.
Competitive analysis
The competitive scenario provided in the alzheimers disease therapeutics market report analyzes, evaluates, and positions companies based on various performance indicators. Some of the factors considered for this analysis include the financial performance of companies over the past few years, growth strategies, product innovations, new product launches, investments, growth in market share, etc. Request a Sample
Market segmentation
- By drug class, the market is segmented into cholinesterase inhibitors, N-methyl-D-aspartate receptor antagonists, and other drug class. The cholinesterase inhibitors segment accounted for the largest share of the market in 2021.
- By geography, the market is segmented as North America, Europe, Asia, and Rest of World (ROW). North America held the largest share of the market in 2021.
Related reports:
The colorectal cancer therapeutics market share is expected to increase to USD 2.45 bn from 2021 to 2026, and the market’s growth momentum will accelerate at a CAGR of 5.43%. Furthermore, this report extensively covers colorectal cancer therapeutics market segmentation by type (targeted therapy, immunotherapy, and chemotherapy) and geography (North America, Europe, Asia, and Rest of World (ROW)).
The gastrointestinal stromal tumors therapeutics market share is expected to increase by USD 1.08 billion from 2021 to 2026, and the market’s growth momentum will accelerate at a CAGR of 5.97%. Furthermore, this report extensively covers the gastrointestinal stromal tumors therapeutics market segmentation by route of administration (oral and parenteral) and geography (North America, Europe, Asia, and the Rest of the World (ROW)).
Technavio’s library includes over 17,000+ reports, covering more than 2,000 emerging technologies. Subscribe to our “Basic Plan” at just USD 5,000 and get lifetime access to Technavio Insights
What are the Key Data Covered in this alzheimer’s disease (AD) therapeutics market Report?
- CAGR of the market during the forecast period 2022-2026
- Detailed information on factors that will drive AD therapeutics market growth during the next five years
- Precise estimation of the AD therapeutics market size and its contribution to the parent market
- Accurate predictions on upcoming trends and changes in consumer behaviour
- The growth of the Alzheimer’s disease therapeutics industry across North America, Europe, Asia, and Rest of World (ROW)
- A thorough analysis of the market’s competitive landscape and detailed information on vendors
- Comprehensive details of factors that will challenge the growth of AD therapeutics market vendors
|
Alzheimers Disease Therapeutics Market Scope |
|
|
Report Coverage |
Details |
|
Page number |
138 |
|
Base year |
2021 |
|
Forecast period |
2022-2026 |
|
Growth momentum & CAGR |
Accelerate at a CAGR of 8.76% |
|
Market growth 2022-2026 |
USD 3.99 billion |
|
Market structure |
Fragmented |
|
YoY growth 2022-2023 (%) |
8.41 |
|
Regional analysis |
North America, Europe, Asia, and Rest of World (ROW) |
|
Performing market contribution |
North America at 37% |
|
Key countries |
US, Canada, UK, Germany, Japan, and China |
|
Competitive landscape |
Leading Vendors, Market Positioning of Vendors, Competitive Strategies, and Industry Risks |
|
Key companies profiled |
AB Science SA, AbbVie Inc., AgeneBio Inc., Aurobindo Pharma Ltd., Biogen Inc., Denali Therapeutics Inc., Eisai Co. Ltd., Eli Lilly and Co., Grifols SA, H Lundbeck AS, Johnson and Johnson, Lupin Ltd., Neuronascent Inc., Novartis AG, Shanghai Green Valley Pharmaceuticals Co. Ltd., Spinogenix Inc., T3D Therapeutics Inc., Teva Pharmaceutical Industries Ltd., Viatris Inc., and Vivoryon Therapeutics AG |
|
Market dynamics |
Parent market analysis, Market growth inducers and obstacles, Fast-growing and slow-growing segment analysis, COVID-19 impact and recovery analysis and future consumer dynamics, and Market condition analysis for the forecast period. |
|
Customization purview |
If our report has not included the data that you are looking for, you can reach out to our analysts and get segments customized. |
Table of Contents:
1 Executive Summary
- 1.1 Market Overview
- Exhibit 01: Executive Summary – Chart on Market Overview
- Exhibit 02: Executive Summary – Data Table on Market Overview
- Exhibit 03: Executive Summary – Chart on Global Market Characteristics
- Exhibit 04: Executive Summary – Chart on Market by Geography
- Exhibit 05: Executive Summary – Chart on Market Segmentation by Drug Class
- Exhibit 06: Executive Summary – Chart on Incremental Growth
- Exhibit 07: Executive Summary – Data Table on Incremental Growth
- Exhibit 08: Executive Summary – Chart on Vendor Market Positioning
2 Market Landscape
- 2.1 Market ecosystem
- Exhibit 09: Parent market
- Exhibit 10: Market Characteristics
3 Market Sizing
- 3.1 Market Definition
- Exhibit 11: Offerings of vendors included in the market definition
- 3.2 Market segment analysis
- Exhibit 12: Market segments
- 3.3 Market size 2021
- 3.4 Market outlook: Forecast for 2021-2026
- Exhibit 13: Chart on Global – Market size and forecast 2021-2026 ($ million)
- Exhibit 14: Data Table on Global – Market size and forecast 2021-2026 ($ million)
- Exhibit 15: Chart on Global Market: Year-over-year growth 2021-2026 (%)
- Exhibit 16: Data Table on Global Market: Year-over-year growth 2021-2026 (%)
4 Five Forces Analysis
- 4.1 Five forces summary
- Exhibit 17: Five forces analysis – Comparison between2021 and 2026
- 4.2 Bargaining power of buyers
- Exhibit 18: Chart on Bargaining power of buyers – Impact of key factors 2021 and 2026
- 4.3 Bargaining power of suppliers
- Exhibit 19: Bargaining power of suppliers – Impact of key factors in 2021 and 2026
- 4.4 Threat of new entrants
- Exhibit 20: Threat of new entrants – Impact of key factors in 2021 and 2026
- 4.5 Threat of substitutes
- Exhibit 21: Threat of substitutes – Impact of key factors in 2021 and 2026
- 4.6 Threat of rivalry
- Exhibit 22: Threat of rivalry – Impact of key factors in 2021 and 2026
- 4.7 Market condition
- Exhibit 23: Chart on Market condition – Five forces 2021 and 2026
5 Market Segmentation by Drug Class
- 5.1 Market segments
- Exhibit 24: Chart on Drug Class – Market share 2021-2026 (%)
- Exhibit 25: Data Table on Drug Class – Market share 2021-2026 (%)
- 5.2 Comparison by Drug Class
- Exhibit 26: Chart on Comparison by Drug Class
- Exhibit 27: Data Table on Comparison by Drug Class
- 5.3 Cholinesterase inhibitors – Market size and forecast 2021-2026
- Exhibit 28: Chart on Cholinesterase inhibitors – Market size and forecast 2021-2026 ($ million)
- Exhibit 29: Data Table on Cholinesterase inhibitors – Market size and forecast 2021-2026 ($ million)
- Exhibit 30: Chart on Cholinesterase inhibitors – Year-over-year growth 2021-2026 (%)
- Exhibit 31: Data Table on Cholinesterase inhibitors – Year-over-year growth 2021-2026 (%)
- 5.4 N-methyl-D-aspartate receptor antagonist – Market size and forecast 2021-2026
- Exhibit 32: Chart on N-methyl-D-aspartate receptor antagonist – Market size and forecast 2021-2026 ($ million)
- Exhibit 33: Data Table on N-methyl-D-aspartate receptor antagonist – Market size and forecast 2021-2026 ($ million)
- Exhibit 34: Chart on N-methyl-D-aspartate receptor antagonist – Year-over-year growth 2021-2026 (%)
- Exhibit 35: Data Table on N-methyl-D-aspartate receptor antagonist – Year-over-year growth 2021-2026 (%)
- 5.5 Other drug class – Market size and forecast 2021-2026
- Exhibit 36: Chart on Other drug class – Market size and forecast 2021-2026 ($ million)
- Exhibit 37: Data Table on Other drug class – Market size and forecast 2021-2026 ($ million)
- Exhibit 38: Chart on Other drug class – Year-over-year growth 2021-2026 (%)
- Exhibit 39: Data Table on Other drug class – Year-over-year growth 2021-2026 (%)
- 5.6 Market opportunity by Drug Class
- Exhibit 40: Market opportunity by Drug Class ($ million)
6 Customer Landscape
- 6.1 Customer landscape overview
- Exhibit 41: Analysis of price sensitivity, lifecycle, customer purchase basket, adoption rates, and purchase criteria
7 Geographic Landscape
- 7.1 Geographic segmentation
- Exhibit 42: Chart on Market share by geography 2021-2026 (%)
- Exhibit 43: Data Table on Market share by geography 2021-2026 (%)
- 7.2 Geographic comparison
- Exhibit 44: Chart on Geographic comparison
- Exhibit 45: Data Table on Geographic comparison
- 7.3 North America – Market size and forecast 2021-2026
- Exhibit 46: Chart on North America – Market size and forecast 2021-2026 ($ million)
- Exhibit 47: Data Table on North America – Market size and forecast 2021-2026 ($ million)
- Exhibit 48: Chart on North America – Year-over-year growth 2021-2026 (%)
- Exhibit 49: Data Table on North America – Year-over-year growth 2021-2026 (%)
- 7.4 Europe – Market size and forecast 2021-2026
- Exhibit 50: Chart on Europe – Market size and forecast 2021-2026 ($ million)
- Exhibit 51: Data Table on Europe – Market size and forecast 2021-2026 ($ million)
- Exhibit 52: Chart on Europe – Year-over-year growth 2021-2026 (%)
- Exhibit 53: Data Table on Europe – Year-over-year growth 2021-2026 (%)
- 7.5 Asia – Market size and forecast 2021-2026
- Exhibit 54: Chart on Asia – Market size and forecast 2021-2026 ($ million)
- Exhibit 55: Data Table on Asia – Market size and forecast 2021-2026 ($ million)
- Exhibit 56: Chart on Asia – Year-over-year growth 2021-2026 (%)
- Exhibit 57: Data Table on Asia – Year-over-year growth 2021-2026 (%)
- 7.6 Rest of World (ROW) – Market size and forecast 2021-2026
- Exhibit 58: Chart on Rest of World (ROW) – Market size and forecast 2021-2026 ($ million)
- Exhibit 59: Data Table on Rest of World (ROW) – Market size and forecast 2021-2026 ($ million)
- Exhibit 60: Chart on Rest of World (ROW) – Year-over-year growth 2021-2026 (%)
- Exhibit 61: Data Table on Rest of World (ROW) – Year-over-year growth 2021-2026 (%)
- 7.7 US – Market size and forecast 2021-2026
- Exhibit 62: Chart on US – Market size and forecast 2021-2026 ($ million)
- Exhibit 63: Data Table on US – Market size and forecast 2021-2026 ($ million)
- Exhibit 64: Chart on US – Year-over-year growth 2021-2026 (%)
- Exhibit 65: Data Table on US – Year-over-year growth 2021-2026 (%)
- 7.8 Canada – Market size and forecast 2021-2026
- Exhibit 66: Chart on Canada – Market size and forecast 2021-2026 ($ million)
- Exhibit 67: Data Table on Canada – Market size and forecast 2021-2026 ($ million)
- Exhibit 68: Chart on Canada – Year-over-year growth 2021-2026 (%)
- Exhibit 69: Data Table on Canada – Year-over-year growth 2021-2026 (%)
- 7.9 UK – Market size and forecast 2021-2026
- Exhibit 70: Chart on UK – Market size and forecast 2021-2026 ($ million)
- Exhibit 71: Data Table on UK – Market size and forecast 2021-2026 ($ million)
- Exhibit 72: Chart on UK – Year-over-year growth 2021-2026 (%)
- Exhibit 73: Data Table on UK – Year-over-year growth 2021-2026 (%)
- 7.10 Germany – Market size and forecast 2021-2026
- Exhibit 74: Chart on Germany – Market size and forecast 2021-2026 ($ million)
- Exhibit 75: Data Table on Germany – Market size and forecast 2021-2026 ($ million)
- Exhibit 76: Chart on Germany – Year-over-year growth 2021-2026 (%)
- Exhibit 77: Data Table on Germany – Year-over-year growth 2021-2026 (%)
- 7.11 Japan – Market size and forecast 2021-2026
- Exhibit 78: Chart on Japan – Market size and forecast 2021-2026 ($ million)
- Exhibit 79: Data Table on Japan – Market size and forecast 2021-2026 ($ million)
- Exhibit 80: Chart on Japan – Year-over-year growth 2021-2026 (%)
- Exhibit 81: Data Table on Japan – Year-over-year growth 2021-2026 (%)
- 7.12 China – Market size and forecast 2021-2026
- Exhibit 82: Chart on China – Market size and forecast 2021-2026 ($ million)
- Exhibit 83: Data Table on China – Market size and forecast 2021-2026 ($ million)
- Exhibit 84: Chart on China – Year-over-year growth 2021-2026 (%)
- Exhibit 85: Data Table on China – Year-over-year growth 2021-2026 (%)
- 7.13 Market opportunity by geography
- Exhibit 86: Market opportunity by geography ($ million)
8 Drivers, Challenges, and Trends
- 8.1 Market drivers
- 8.2 Market challenges
- 8.3 Impact of drivers and challenges
- Exhibit 87: Impact of drivers and challenges in 2021 and 2026
- 8.4 Market trends
9 Vendor Landscape
- 9.1 Overview
- 9.2 Vendor landscape
- Exhibit 88: Overview on Criticality of inputs and Factors of differentiation
- 9.3 Landscape disruption
- Exhibit 89: Overview on factors of disruption
- 9.4 Industry risks
- Exhibit 90: Impact of key risks on business
10 Vendor Analysis
- 10.1 Vendors covered
- Exhibit 91: Vendors covered
- 10.2 Market positioning of vendors
- Exhibit 92: Matrix on vendor position and classification
- 10.3 AbbVie Inc.
- Exhibit 93: AbbVie Inc. – Overview
- Exhibit 94: AbbVie Inc. – Product / Service
- Exhibit 95: AbbVie Inc. – Key offerings
- 10.4 Aurobindo Pharma Ltd.
- Exhibit 96: Aurobindo Pharma Ltd. – Overview
- Exhibit 97: Aurobindo Pharma Ltd. – Product / Service
- Exhibit 98: Aurobindo Pharma Ltd. – Key offerings
- 10.5 Eisai Co. Ltd.
- Exhibit 99: Eisai Co. Ltd. – Overview
- Exhibit 100: Eisai Co. Ltd. – Business segments
- Exhibit 101: Eisai Co. Ltd. – Key offerings
- Exhibit 102: Eisai Co. Ltd. – Segment focus
- 10.6 Eli Lilly and Co.
- Exhibit 103: Eli Lilly and Co. – Overview
- Exhibit 104: Eli Lilly and Co. – Product / Service
- Exhibit 105: Eli Lilly and Co. – Key offerings
- 10.7 H Lundbeck AS
- Exhibit 106: H Lundbeck AS – Overview
- Exhibit 107: H Lundbeck AS – Product / Service
- Exhibit 108: H Lundbeck AS – Key offerings
- 10.8 Johnson and Johnson
- Exhibit 109: Johnson and Johnson – Overview
- Exhibit 110: Johnson and Johnson – Business segments
- Exhibit 111: Johnson and Johnson – Key news
- Exhibit 112: Johnson and Johnson – Key offerings
- Exhibit 113: Johnson and Johnson – Segment focus
- 10.9 Lupin Ltd.
- Exhibit 114: Lupin Ltd. – Overview
- Exhibit 115: Lupin Ltd. – Product / Service
- Exhibit 116: Lupin Ltd. – Key news
- Exhibit 117: Lupin Ltd. – Key offerings
- 10.10 Novartis AG
- Exhibit 118: Novartis AG – Overview
- Exhibit 119: Novartis AG – Business segments
- Exhibit 120: Novartis AG – Key offerings
- Exhibit 121: Novartis AG – Segment focus
- 10.11 Teva Pharmaceutical Industries Ltd.
- Exhibit 122: Teva Pharmaceutical Industries Ltd. – Overview
- Exhibit 123: Teva Pharmaceutical Industries Ltd. – Business segments
- Exhibit 124: Teva Pharmaceutical Industries Ltd. – Key news
- Exhibit 125: Teva Pharmaceutical Industries Ltd. – Key offerings
- Exhibit 126: Teva Pharmaceutical Industries Ltd. – Segment focus
- 10.12 Viatris Inc.
- Exhibit 127: Viatris Inc. – Overview
- Exhibit 128: Viatris Inc. – Business segments
- Exhibit 129: Viatris Inc. – Key offerings
- Exhibit 130: Viatris Inc. – Segment focus
11 Appendix
- 11.1 Scope of the report
- 11.2 Inclusions and exclusions checklist
- Exhibit 131: Inclusions checklist
- Exhibit 132: Exclusions checklist
- 11.3 Currency conversion rates for US$
- Exhibit 133: Currency conversion rates for US$
- 11.4 Research methodology
- Exhibit 134: Research methodology
- Exhibit 135: Validation techniques employed for market sizing
- Exhibit 136: Information sources
- 11.5 List of abbreviations
- Exhibit 137: List of abbreviations
About Us
Technavio is a leading global technology research and advisory company. Their research and analysis focus on emerging market trends and provide actionable insights to help businesses identify market opportunities and develop effective strategies to optimize their market positions. With over 500 specialized analysts, Technavio’s report library consists of more than 17,000 reports and counting, covering 800 technologies, spanning 50 countries. Their client base consists of enterprises of all sizes, including more than 100 Fortune 500 companies. This growing client base relies on Technavio’s comprehensive coverage, extensive research, and actionable market insights to identify opportunities in existing and potential markets and assess their competitive positions within changing market scenarios.
Contact
Technavio Research
Jesse Maida
Media & Marketing Executive
US: +1 844 364 1100
UK: +44 203 893 3200
Email: media@technavio.com
Website: www.technavio.com/
![]()
![]() View original content to download multimedia:https://www.prnewswire.com/news-releases/alzheimers-disease-therapeutics-market-size-to-increase-by-usd-3-99-billion-north-america-to-account-for-37-of-market-growth—technavio-301740303.html
View original content to download multimedia:https://www.prnewswire.com/news-releases/alzheimers-disease-therapeutics-market-size-to-increase-by-usd-3-99-billion-north-america-to-account-for-37-of-market-growth—technavio-301740303.html
SOURCE Technavio

Source link
The content is by PR Newswire. Headlines of Today Media is not responsible for the content provided or any links related to this content. Headlines of Today Media is not responsible for the correctness, topicality or the quality of the content.