[ad_2]
NEW YORK, Oct. 31, 2022 /PRNewswire/ — The “AI Market In Recruitment Industry by Component (Services and Solutions) and Geography (North America, Europe, APAC, Middle East and Africa, and South America) – Forecast and Analysis 2022-2026″ report has been added to Technavio’s offering. With ISO 9001:2015 certification, Technavio is proudly partnering with more than 100 Fortune 500 companies for over 16 years.

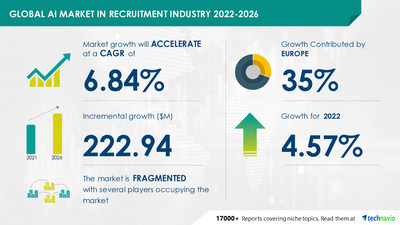
The potential growth difference for the AI market in the recruitment industry between 2021 and 2026 is USD 222.94 million. To get the exact yearly growth variance and the Y-O-Y growth rate, Request a Free PDF Sample Report.
- Market Driver: The increasing need for automated process is one of the major factors driving the growth of the market. The demand for automated processes for screening and shortlisting candidates has grown significantly in the recruitment industry. The adoption of AI has enabled the processing of hundreds of resumes per minute, reducing human errors, and increasing the reliability of the hiring process. The automated procedure improves candidate involvement by making scheduling easier. Furthermore, using automated processes leads to the use of a candidate relationship management (CRM) system to efficiently operate recruitment operations. All these factors are driving the growth of the market in focus.
- Market Challenges: The threat from open-source recruitment software is the key challenge in the market. Open-source recruitment software can be downloaded and run on all platforms, and hence, it is becoming increasingly popular in developing economies, such as India and China. This software is not only free but can also be customized according to the end-users’ requirements. Besides, using open-source recruitment software ensures that such enterprises incur lower upfront costs and gain more flexibility. Thus, many enterprises, especially SMEs that are looking for better plans to expand their businesses at a low cost, opt for open-source recruitment software.
To learn about additional key drivers, trends, and challenges available with Technavio, View our FREE Sample Report right now!
By component, the services segment will be a significant contributor to market growth during the forecast period. Recruitment software is considered highly secure, as there is no third-party interference. Enterprises also have full control over their service solutions because of monitored and restricted access, while it also allows them to customize the recruitment software according to their requirements. Such benefits are leading to the growth of the segment.
Get lifetime access to our Technavio Insights! Subscribe to our Basic Plan billed annually at USD 5000
By geography, Europe will be the leading region with 35% of the market’s growth during the forecast period. The UK and Germany are the key markets in Europe. Market growth in this region will be faster than the growth of the market in South America and North America.
- Alphabet Inc.
- Beamery Inc.
- Brilent Inc.
- CVViZ Softwares Pvt Ltd.
- Entelo Inc.
- Gloat Inc.
- hackajob Ltd.
- Harver B.V.
- HireTeamMate Inc.
- International Business Machines Corp.
- Jobiak
- Jobvite Inc.
- Leoforce LLC.
- O5 Systems Inc.
- Oracle Corp.
- SAP SE
- SmartRecruiters Inc.
- Talent Recruit Software Pvt. Ltd.
- UKG Inc.
- Zoho Corp. Pvt. Ltd.
- Gain access to more vendor profiles with their key offerings available with Technavio. Buy Report Now
Artificial Intelligence (AI) Market in BFSI Sector by Service and Geography – Forecast and Analysis 2022-2026: The enhanced operational efficiency with ai is notably driving the artificial intelligence (AI) market growth in the BFSI sector, although factors such as the need for high data quality may impede the market growth. The banking and financial services industries are adopting AI-based solutions to improve their operational efficiency and improve customer experience. Increasing customer expectations in terms of improved service delivery are driving traditional banks and financial institutions to adopt advanced technologies such as AI and big data.
Artificial Intelligence (AI) Market in Healthcare Sector by Application and Geography – Forecast and Analysis 2022-2026: The push for digitization in healthcare is notably driving the AI market growth in healthcare sector, although factors such as physician and provider skepticism may impede market growth. Digitalized healthcare simplifies the delivery of healthcare services and helps in the easy and secure management of patient data. The high demand for connected healthcare services is driving the demand for the adoption of advanced technologies, including ai, AR, and advanced analytics.
|
AI market In Recruitment Industry Scope |
|
|
Report Coverage |
Details |
|
Page number |
120 |
|
Base year |
2021 |
|
Forecast period |
2022-2026 |
|
Growth momentum & CAGR |
Accelerate at a CAGR of 6.84% |
|
Market growth 2022-2026 |
USD 222.94 million |
|
Market structure |
Fragmented |
|
YoY growth (%) |
4.57 |
|
Regional analysis |
North America, Europe, APAC, Middle East and Africa, and South America |
|
Performing market contribution |
Europe at 35% |
|
Key consumer countries |
US, China, Japan, UK, and Germany |
|
Competitive landscape |
Leading companies, competitive strategies, consumer engagement scope |
|
Companies profiled |
Alphabet Inc., Beamery Inc., Brilent Inc., CVViZ Softwares Pvt Ltd., Entelo Inc., Gloat Inc., hackajob Ltd., Harver B.V., HireTeamMate Inc., International Business Machines Corp., Jobiak, Jobvite Inc., Leoforce LLC., O5 Systems Inc., Oracle Corp., SAP SE, SmartRecruiters Inc., Talent Recruit Software Pvt. Ltd., UKG Inc., and Zoho Corp. Pvt. Ltd. |
|
Market Dynamics |
Parent market analysis, Market growth inducers and obstacles, Fast-growing and slow-growing segment analysis, COVID-19 impact and future consumer dynamics, and market condition analysis for the forecast period. |
|
Customization purview |
If our report has not included the data that you are looking for, you can reach out to our analysts and get segments customized. |
1 Executive Summary
- 1.1 Market overview
- Exhibit 01: Executive Summary – Chart on Market Overview
- Exhibit 02: Executive Summary – Data Table on Market Overview
- Exhibit 03: Executive Summary – Chart on Global Market Characteristics
- Exhibit 04: Executive Summary – Chart on Market by Geography
- Exhibit 05: Executive Summary – Chart on Market Segmentation by Component
- Exhibit 06: Executive Summary – Chart on Incremental Growth
- Exhibit 07: Executive Summary – Data Table on Incremental Growth
- Exhibit 08: Executive Summary – Chart on Vendor Market Positioning
2 Market Landscape
- 2.1 Market ecosystem
- Exhibit 09: Parent market
- Exhibit 10: Market Characteristics
3 Market Sizing
- 3.1 Market definition
- Exhibit 11: Offerings of vendors included in the market definition
- 3.2 Market segment analysis
- Exhibit 12: Market segments
- 3.3 Market size 2021
- 3.4 Market outlook: Forecast for 2021-2026
- Exhibit 13: Chart on Global – Market size and forecast 2021-2026 ($ million)
- Exhibit 14: Data Table on Global – Market size and forecast 2021-2026 ($ million)
- Exhibit 15: Chart on Global Market: Year-over-year growth 2021-2026 (%)
- Exhibit 16: Data Table on Global Market: Year-over-year growth 2021-2026 (%)
4 Five Forces Analysis
- 4.1 Five forces summary
- Exhibit 17: Five forces analysis – Comparison between 2021 and 2026
- 4.2 Bargaining power of buyers
- Exhibit 18: Chart on Bargaining power of buyers – Impact of key factors 2021 and 2026
- 4.3 Bargaining power of suppliers
- Exhibit 19: Bargaining power of suppliers – Impact of key factors in 2021 and 2026
- 4.4 Threat of new entrants
- Exhibit 20: Threat of new entrants – Impact of key factors in 2021 and 2026
- 4.5 Threat of substitutes
- Exhibit 21: Threat of substitutes – Impact of key factors in 2021 and 2026
- 4.6 Threat of rivalry
- Exhibit 22: Threat of rivalry – Impact of key factors in 2021 and 2026
- 4.7 Market condition
- Exhibit 23: Chart on Market condition – Five forces 2021 and 2026
5 Market Segmentation by Component
- 5.1 Market segments
- Exhibit 24: Chart on Component – Market share 2021-2026 (%)
- Exhibit 25: Data Table on Component – Market share 2021-2026 (%)
- 5.2 Comparison by Component
- Exhibit 26: Chart on Comparison by Component
- Exhibit 27: Data Table on Comparison by Component
- 5.3 Services – Market size and forecast 2021-2026
- Exhibit 28: Chart on Services – Market size and forecast 2021-2026 ($ million)
- Exhibit 29: Data Table on Services – Market size and forecast 2021-2026 ($ million)
- Exhibit 30: Chart on Services – Year-over-year growth 2021-2026 (%)
- Exhibit 31: Data Table on Services – Year-over-year growth 2021-2026 (%)
- 5.4 Solutions – Market size and forecast 2021-2026
- Exhibit 32: Chart on Solutions – Market size and forecast 2021-2026 ($ million)
- Exhibit 33: Data Table on Solutions – Market size and forecast 2021-2026 ($ million)
- Exhibit 34: Chart on Solutions – Year-over-year growth 2021-2026 (%)
- Exhibit 35: Data Table on Solutions – Year-over-year growth 2021-2026 (%)
- 5.5 Market opportunity by Component
- Exhibit 36: Market opportunity by Component ($ million)
6 Customer Landscape
- 6.1 Customer landscape overview
- Exhibit 37: Analysis of price sensitivity, lifecycle, customer purchase basket, adoption rates, and purchase criteria
7 Geographic Landscape
- 7.1 Geographic segmentation
- Exhibit 38: Chart on Market share by geography 2021-2026 (%)
- Exhibit 39: Data Table on Market share by geography 2021-2026 (%)
- 7.2 Geographic comparison
- Exhibit 40: Chart on Geographic comparison
- Exhibit 41: Data Table on Geographic comparison
- 7.3 North America – Market size and forecast 2021-2026
- Exhibit 42: Chart on North America – Market size and forecast 2021-2026 ($ million)
- Exhibit 43: Data Table on North America – Market size and forecast 2021-2026 ($ million)
- Exhibit 44: Chart on North America – Year-over-year growth 2021-2026 (%)
- Exhibit 45: Data Table on North America – Year-over-year growth 2021-2026 (%)
- 7.4 Europe – Market size and forecast 2021-2026
- Exhibit 46: Chart on Europe – Market size and forecast 2021-2026 ($ million)
- Exhibit 47: Data Table on Europe – Market size and forecast 2021-2026 ($ million)
- Exhibit 48: Chart on Europe – Year-over-year growth 2021-2026 (%)
- Exhibit 49: Data Table on Europe – Year-over-year growth 2021-2026 (%)
- 7.5 APAC – Market size and forecast 2021-2026
- Exhibit 50: Chart on APAC – Market size and forecast 2021-2026 ($ million)
- Exhibit 51: Data Table on APAC – Market size and forecast 2021-2026 ($ million)
- Exhibit 52: Chart on APAC – Year-over-year growth 2021-2026 (%)
- Exhibit 53: Data Table on APAC – Year-over-year growth 2021-2026 (%)
- 7.6 Middle East and Africa – Market size and forecast 2021-2026
- Exhibit 54: Chart on Middle East and Africa – Market size and forecast 2021-2026 ($ million)
- Exhibit 55: Data Table on Middle East and Africa – Market size and forecast 2021-2026 ($ million)
- Exhibit 56: Chart on Middle East and Africa – Year-over-year growth 2021-2026 (%)
- Exhibit 57: Data Table on Middle East and Africa – Year-over-year growth 2021-2026 (%)
- 7.7 South America – Market size and forecast 2021-2026
- Exhibit 58: Chart on South America – Market size and forecast 2021-2026 ($ million)
- Exhibit 59: Data Table on South America – Market size and forecast 2021-2026 ($ million)
- Exhibit 60: Chart on South America – Year-over-year growth 2021-2026 (%)
- Exhibit 61: Data Table on South America – Year-over-year growth 2021-2026 (%)
- 7.8 US – Market size and forecast 2021-2026
- Exhibit 62: Chart on US – Market size and forecast 2021-2026 ($ million)
- Exhibit 63: Data Table on US – Market size and forecast 2021-2026 ($ million)
- Exhibit 64: Chart on US – Year-over-year growth 2021-2026 (%)
- Exhibit 65: Data Table on US – Year-over-year growth 2021-2026 (%)
- 7.9 China – Market size and forecast 2021-2026
- Exhibit 66: Chart on China – Market size and forecast 2021-2026 ($ million)
- Exhibit 67: Data Table on China – Market size and forecast 2021-2026 ($ million)
- Exhibit 68: Chart on China – Year-over-year growth 2021-2026 (%)
- Exhibit 69: Data Table on China – Year-over-year growth 2021-2026 (%)
- 7.10 UK – Market size and forecast 2021-2026
- Exhibit 70: Chart on UK – Market size and forecast 2021-2026 ($ million)
- Exhibit 71: Data Table on UK – Market size and forecast 2021-2026 ($ million)
- Exhibit 72: Chart on UK – Year-over-year growth 2021-2026 (%)
- Exhibit 73: Data Table on UK – Year-over-year growth 2021-2026 (%)
- 7.11 Germany – Market size and forecast 2021-2026
- Exhibit 74: Chart on Germany – Market size and forecast 2021-2026 ($ million)
- Exhibit 75: Data Table on Germany – Market size and forecast 2021-2026 ($ million)
- Exhibit 76: Chart on Germany – Year-over-year growth 2021-2026 (%)
- Exhibit 77: Data Table on Germany – Year-over-year growth 2021-2026 (%)
- 7.12 Japan – Market size and forecast 2021-2026
- Exhibit 78: Chart on Japan – Market size and forecast 2021-2026 ($ million)
- Exhibit 79: Data Table on Japan – Market size and forecast 2021-2026 ($ million)
- Exhibit 80: Chart on Japan – Year-over-year growth 2021-2026 (%)
- Exhibit 81: Data Table on Japan – Year-over-year growth 2021-2026 (%)
- 7.13 Market opportunity by geography
- Exhibit 82: Market opportunity by geography ($ million)
8 Drivers, Challenges, and Trends
- 8.1 Market drivers
- 8.2 Market challenges
- 8.3 Impact of drivers and challenges
- Exhibit 83: Impact of drivers and challenges in 2021 and 2026
- 8.4 Market trends
9 Vendor Landscape
- 9.1 Overview
- 9.2 Vendor landscape
- Exhibit 84: Overview on Criticality of inputs and Factors of differentiation
- 9.3 Landscape disruption
- Exhibit 85: Overview on factors of disruption
- 9.4 Industry risks
- Exhibit 86: Impact of key risks on business
10 Vendor Analysis
- 10.1 Vendors covered
- Exhibit 87: Vendors covered
- 10.2 Market positioning of vendors
- Exhibit 88: Matrix on vendor position and classification
- 10.3 Beamery Inc.
- Exhibit 89: Beamery Inc. – Overview
- Exhibit 90: Beamery Inc. – Product / Service
- Exhibit 91: Beamery Inc. – Key offerings
- 10.4 Brilent Inc.
- Exhibit 92: Brilent Inc. – Overview
- Exhibit 93: Brilent Inc. – Product / Service
- Exhibit 94: Brilent Inc. – Key offerings
- 10.5 Entelo Inc.
- Exhibit 95: Entelo Inc. – Overview
- Exhibit 96: Entelo Inc. – Product / Service
- Exhibit 97: Entelo Inc. – Key offerings
- 10.6 Gloat Inc.
- Exhibit 98: Gloat Inc. – Overview
- Exhibit 99: Gloat Inc. – Product / Service
- Exhibit 100: Gloat Inc. – Key offerings
- 10.7 hackajob Ltd.
- Exhibit 101: hackajob Ltd. – Overview
- Exhibit 102: hackajob Ltd. – Product / Service
- Exhibit 103: hackajob Ltd. – Key offerings
- 10.8 HireTeamMate Inc.
- Exhibit 104: HireTeamMate Inc. – Overview
- Exhibit 105: HireTeamMate Inc. – Product / Service
- Exhibit 106: HireTeamMate Inc. – Key offerings
- 10.9 International Business Machines Corp.
- Exhibit 107: International Business Machines Corp. – Overview
- Exhibit 108: International Business Machines Corp. – Business segments
- Exhibit 109: International Business Machines Corp. – Key offerings
- Exhibit 110: International Business Machines Corp. – Segment focus
- 10.10 Jobiak
- Exhibit 111: Jobiak – Overview
- Exhibit 112: Jobiak – Product / Service
- Exhibit 113: Jobiak – Key offerings
- 10.11 Leoforce LLC.
- Exhibit 114: Leoforce LLC. – Overview
- Exhibit 115: Leoforce LLC. – Product / Service
- Exhibit 116: Leoforce LLC. – Key offerings
- 10.12 O5 Systems Inc.
- Exhibit 117: O5 Systems Inc. – Overview
- Exhibit 118: O5 Systems Inc. – Product / Service
- Exhibit 119: O5 Systems Inc. – Key offerings
11 Appendix
- 11.1 Scope of the report
- 11.2 Inclusions and exclusions checklist
- Exhibit 120: Inclusions checklist
- Exhibit 121: Exclusions checklist
- 11.3 Currency conversion rates for US$
- Exhibit 122: Currency conversion rates for US$
- 11.4 Research methodology
- Exhibit 123: Research methodology
- Exhibit 124: Validation techniques employed for market sizing
- Exhibit 125: Information sources
- 11.5 List of abbreviations
- Exhibit 126: List of abbreviations
Technavio is a leading global technology research and advisory company. Their research and analysis focuses on emerging market trends and provides actionable insights to help businesses identify market opportunities and develop effective strategies to optimize their market positions.
With over 500 specialized analysts, Technavio’s report library consists of more than 17,000 reports and counting, covering 800 technologies, spanning across 50 countries. Their client base consists of enterprises of all sizes, including more than 100 Fortune 500 companies. This growing client base relies on Technavio’s comprehensive coverage, extensive research, and actionable market insights to identify opportunities in existing and potential markets and assess their competitive positions within changing market scenarios.
Contact
Technavio Research
Jesse Maida
Media & Marketing Executive
US: +1 844 364 1100
UK: +44 203 893 3200
Email:media@technavio.com
Website: www.technavio.com/
![]()
![]() View original content to download multimedia:https://www.prnewswire.com/news-releases/ai-market-in-recruitment-industry-to-observe-usd-222-94-mn-incremental-growth-increasing-need-for-automated-process-to-boost-market-growth–technavio-301662013.html
View original content to download multimedia:https://www.prnewswire.com/news-releases/ai-market-in-recruitment-industry-to-observe-usd-222-94-mn-incremental-growth-increasing-need-for-automated-process-to-boost-market-growth–technavio-301662013.html
SOURCE Technavio

Source link
[ad_2]
The content is by PR Newswire. Headlines of Today Media is not responsible for the content provided or any links related to this content. Headlines of Today Media is not responsible for the correctness, topicality or the quality of the content.
[ad_2]