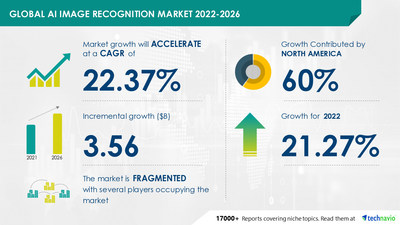
NEW YORK, May 16, 2022 /PRNewswire/ — The AI image recognition market size is set to grow by USD 3.56 billion from 2021 to 2026 as per the latest market report by Technavio. The report projects the market to progress at a CAGR of 22.37%. 60% of the market’s growth will originate from North America during the forecast period. The US is the key market for AI image recognition in North America. Market growth in this region will be slower than the growth of the market in the South American, APAC, and MEA regions. The high expenditure on R&D by the government and private organizations in AI technology will facilitate the AI image recognition market growth in North America over the forecast period

For more insights on the market share of various regions – Request a Sample Report
AI Image Recognition Market: Segmentation Analysis
This market research report segments the AI image recognition market by End-user (BFSI, Automotive, Retail, Security, and Others) and Geography (North America, APAC, Europe, South America, and the Middle East and Africa).
The AI image recognition market share growth by the BFSI segment will be significant for revenue generation. The BFSI sector is a major contributor to AI image recognition, with firms in the industry relying on the technology for a diverse range of applications, such as personalizing communication with customers, staying competitive in a continuously evolving market, and improving productivity drastically through automation of monotonous tasks. With the growing importance of image processing and recognition application of AI in the BFSI sector, the market is expected to witness positive growth during the forecast period.
To gain further insights into the market contribution of various segments – Download a sample report
AI Image Recognition Market: Advances in the medical imaging field to drive growth
The key factor driving growth in the AI image recognition market is the advances in the medical imaging field. As the demand for medical imaging systems grows, there will be a simultaneous increase in the demand for medical image analysis software, as image analysis is an important aspect of medical imaging and helps in diagnostics. Medical imaging is a vital part of the diagnostic process. In the last decade, the capabilities of medical imaging have increased noticeably. With advanced research and technological evolution, medical imaging has witnessed numerous advances in technology. Open and portable MRIs, big data and analytics, and 3D technologies in diagnostic radiology are some of the latest advances that have increased the capabilities of medical imaging systems. As the adoption of medical imaging increases, there will be greater demand for software that will provide an in-depth analysis of these images for diagnoses. Hence, the demand for medical image analysis software will increase with technological advances in medical imaging systems during the forecast period.
AI Image Recognition Market: Growing popularity of cloud-based image analysis solutions is a trend
The growing popularity of cloud-based image analysis solutions is a key AI image recognition market trend that is expected to have a positive impact in the coming years. In the last few years, advanced software for the analysis and processing of medical images has gained popularity among physicians and healthcare practitioners. The software provides valuable clinical information and improves disease diagnosis and treatment. However, the installation of these imaging tools often requires major capital investments in both hardware and applications. This eventually increases operational expenses and medical costs. To tackle this hurdle, healthcare providers are increasingly shifting to cloud computing and adopting the Software-as-a-Service (SaaS) model. However, shifting to the cloud environment gives rise to security and privacy problems, especially given the criticality of the data in the healthcare domain. Various security measures and mechanisms can be taken by healthcare companies, including strong and integrated security software, to overcome these challenges.
To know about other drivers & trends along with challenges – Request a Sample Research Report
Don’t wait, Make a strategic approach & boost your business goals with our AI Image Recognition Market Forecast Report – Buy Now!
Related Reports:
- The artificial intelligence (AI) market size in the food and beverage industry is expected to be valued at USD 5.66 billion by 2026 with a progressing CAGR of 21.93%. Download a sample now!
- The software-defined perimeter (SDP) market share is estimated to reach a value of USD 14.65 billion from 2021 to 2026 at an accelerating CAGR of 36.37%. Download a sample now!
|
AI Image Recognition Market Scope |
|
|
Report Coverage |
Details |
|
Page number |
120 |
|
Base year |
2021 |
|
Forecast period |
2022-2026 |
|
Growth momentum & CAGR |
Accelerate at a CAGR of 22.37% |
|
Market growth 2022-2026 |
USD 3.56 billion |
|
Market structure |
Fragmented |
|
YoY growth (%) |
21.27 |
|
Performing market contribution |
North America at 60% |
|
Competitive landscape |
Leading companies, competitive strategies, consumer engagement scope |
|
Companies profiled |
Alphabet Inc., Amazon.com Inc., Clarifai Inc., Hitachi Ltd., Honeywell International Inc., International Business Machines Corp., Intel Corp., LTU TECH, Micron Technology Inc., Microsoft Corp., NEC Corp., NVIDIA Corp., Qualcomm Inc., Samsung Electronics Co. Ltd., Slyce Acquisition Inc., Vispera information technologies, Wikitude GmbH, and Xilinx Inc. |
|
Market Dynamics |
Parent market analysis, Market growth inducers and obstacles, Fast-growing and slow-growing segment analysis, COVID 19 impact and future consumer dynamics, market condition analysis for forecast period, |
|
Customization purview |
If our report has not included the data that you are looking for, you can reach out to our analysts and get segments customized. |
Table of Content
1 Executive Summary
- 1.1 Market overview
- Exhibit 01: Executive Summary – Chart on Market Overview
- Exhibit 02: Executive Summary – Data Table on Market Overview
- Exhibit 03: Executive Summary – Chart on Global Market Characteristics
- Exhibit 04: Executive Summary – Chart on Market by Geography
- Exhibit 05: Executive Summary – Chart on Market Segmentation by End-user
- Exhibit 06: Executive Summary – Chart on Incremental Growth
- Exhibit 07: Executive Summary – Data Table on Incremental Growth
- Exhibit 08: Executive Summary – Chart on Vendor Market Positioning
2 Market Landscape
- 2.1 Market ecosystem
- Exhibit 09: Parent market
- Exhibit 10: Market Characteristics
3 Market Sizing
- 3.1 Market definition
- Exhibit 11: Offerings of vendors included in the market definition
- 3.2 Market segment analysis
- Exhibit 12: Market segments
- 3.3 Market size 2021
- 3.4 Market outlook: Forecast for 2021-2026
- Exhibit 13: Chart on Global – Market size and forecast 2021-2026 ($ million)
- Exhibit 14: Data Table on Global – Market size and forecast 2021-2026 ($ million)
- Exhibit 15: Chart on Global Market: Year-over-year growth 2021-2026 (%)
- Exhibit 16: Data Table on Global Market: Year-over-year growth 2021-2026 (%)
4 Five Forces Analysis
- 4.1 Five forces summary
- Exhibit 17: Five forces analysis – Comparison between2021 and 2026
- 4.2 Bargaining power of buyers
- Exhibit 18: Chart on Bargaining power of buyers – Impact of key factors 2021 and 2026
- 4.3 Bargaining power of suppliers
- Exhibit 19: Bargaining power of suppliers – Impact of key factors in 2021 and 2026
- 4.4 Threat of new entrants
- Exhibit 20: Threat of new entrants – Impact of key factors in 2021 and 2026
- 4.5 Threat of substitutes
- Exhibit 21: Threat of substitutes – Impact of key factors in 2021 and 2026
- 4.6 Threat of rivalry
- Exhibit 22: Threat of rivalry – Impact of key factors in 2021 and 2026
- 4.7 Market condition
- Exhibit 23: Chart on Market condition – Five forces 2021 and 2026
5 Market Segmentation by End-user
- 5.1 Market segments
- Exhibit 24: Chart on End-user – Market share 2021-2026 (%)
- Exhibit 25: Data Table on End-user – Market share 2021-2026 (%)
- 5.2 Comparison by End-user
- Exhibit 26: Chart on Comparison by End-user
- Exhibit 27: Data Table on Comparison by End-user
- 5.3 BFSI – Market size and forecast 2021-2026
- Exhibit 28: Chart on BFSI – Market size and forecast 2021-2026 ($ million)
- Exhibit 29: Data Table on BFSI – Market size and forecast 2021-2026 ($ million)
- Exhibit 30: Chart on BFSI – Year-over-year growth 2021-2026 (%)
- Exhibit 31: Data Table on BFSI – Year-over-year growth 2021-2026 (%)
- 5.4 Automotive – Market size and forecast 2021-2026
- Exhibit 32: Chart on Automotive – Market size and forecast 2021-2026 ($ million)
- Exhibit 33: Data Table on Automotive – Market size and forecast 2021-2026 ($ million)
- Exhibit 34: Chart on Automotive – Year-over-year growth 2021-2026 (%)
- Exhibit 35: Data Table on Automotive – Year-over-year growth 2021-2026 (%)
- 5.5 Retail – Market size and forecast 2021-2026
- Exhibit 36: Chart on Retail – Market size and forecast 2021-2026 ($ million)
- Exhibit 37: Data Table on Retail – Market size and forecast 2021-2026 ($ million)
- Exhibit 38: Chart on Retail – Year-over-year growth 2021-2026 (%)
- Exhibit 39: Data Table on Retail – Year-over-year growth 2021-2026 (%)
- 5.6 Security – Market size and forecast 2021-2026
- Exhibit 40: Chart on Security – Market size and forecast 2021-2026 ($ million)
- Exhibit 41: Data Table on Security – Market size and forecast 2021-2026 ($ million)
- Exhibit 42: Chart on Security – Year-over-year growth 2021-2026 (%)
- Exhibit 43: Data Table on Security – Year-over-year growth 2021-2026 (%)
- 5.7 Others – Market size and forecast 2021-2026
- Exhibit 44: Chart on Others – Market size and forecast 2021-2026 ($ million)
- Exhibit 45: Data Table on Others – Market size and forecast 2021-2026 ($ million)
- Exhibit 46: Chart on Others – Year-over-year growth 2021-2026 (%)
- Exhibit 47: Data Table on Others – Year-over-year growth 2021-2026 (%)
- 5.8 Market opportunity by End-user
- Exhibit 48: Market opportunity by End-user ($ million)
6 Customer Landscape
- 6.1 Customer landscape overview
- Exhibit 49: Analysis of price sensitivity, lifecycle, customer purchase basket, adoption rates, and purchase criteria
7 Geographic Landscape
- 7.1 Geographic segmentation
- Exhibit 50: Chart on Market share by geography 2021-2026 (%)
- Exhibit 51: Data Table on Market share by geography 2021-2026 (%)
- 7.2 Geographic comparison
- Exhibit 52: Chart on Geographic comparison
- Exhibit 53: Data Table on Geographic comparison
- 7.3 North America – Market size and forecast 2021-2026
- Exhibit 54: Chart on North America – Market size and forecast 2021-2026 ($ million)
- Exhibit 55: Data Table on North America – Market size and forecast 2021-2026 ($ million)
- Exhibit 56: Chart on North America – Year-over-year growth 2021-2026 (%)
- Exhibit 57: Data Table on North America – Year-over-year growth 2021-2026 (%)
- 7.4 APAC – Market size and forecast 2021-2026
- Exhibit 58: Chart on APAC – Market size and forecast 2021-2026 ($ million)
- Exhibit 59: Data Table on APAC – Market size and forecast 2021-2026 ($ million)
- Exhibit 60: Chart on APAC – Year-over-year growth 2021-2026 (%)
- Exhibit 61: Data Table on APAC – Year-over-year growth 2021-2026 (%)
- 7.5 Europe – Market size and forecast 2021-2026
- Exhibit 62: Chart on Europe – Market size and forecast 2021-2026 ($ million)
- Exhibit 63: Data Table on Europe – Market size and forecast 2021-2026 ($ million)
- Exhibit 64: Chart on Europe – Year-over-year growth 2021-2026 (%)
- Exhibit 65: Data Table on Europe – Year-over-year growth 2021-2026 (%)
- 7.6 South America – Market size and forecast 2021-2026
- Exhibit 66: Chart on South America – Market size and forecast 2021-2026 ($ million)
- Exhibit 67: Data Table on South America – Market size and forecast 2021-2026 ($ million)
- Exhibit 68: Chart on South America – Year-over-year growth 2021-2026 (%)
- Exhibit 69: Data Table on South America – Year-over-year growth 2021-2026 (%)
- 7.7 Middle East and Africa – Market size and forecast 2021-2026
- Exhibit 70: Chart on Middle East and Africa – Market size and forecast 2021-2026 ($ million)
- Exhibit 71: Data Table on Middle East and Africa – Market size and forecast 2021-2026 ($ million)
- Exhibit 72: Chart on Middle East and Africa – Year-over-year growth 2021-2026 (%)
- Exhibit 73: Data Table on Middle East and Africa – Year-over-year growth 2021-2026 (%)
- 7.8 US – Market size and forecast 2021-2026
- Exhibit 74: Chart on US – Market size and forecast 2021-2026 ($ million)
- Exhibit 75: Data Table on US – Market size and forecast 2021-2026 ($ million)
- Exhibit 76: Chart on US – Year-over-year growth 2021-2026 (%)
- Exhibit 77: Data Table on US – Year-over-year growth 2021-2026 (%)
- 7.9 China – Market size and forecast 2021-2026
- Exhibit 78: Chart on China – Market size and forecast 2021-2026 ($ million)
- Exhibit 79: Data Table on China – Market size and forecast 2021-2026 ($ million)
- Exhibit 80: Chart on China – Year-over-year growth 2021-2026 (%)
- Exhibit 81: Data Table on China – Year-over-year growth 2021-2026 (%)
- 7.10 Germany – Market size and forecast 2021-2026
- Exhibit 82: Chart on Germany – Market size and forecast 2021-2026 ($ million)
- Exhibit 83: Data Table on Germany – Market size and forecast 2021-2026 ($ million)
- Exhibit 84: Chart on Germany – Year-over-year growth 2021-2026 (%)
- Exhibit 85: Data Table on Germany – Year-over-year growth 2021-2026 (%)
- 7.11 UK – Market size and forecast 2021-2026
- Exhibit 86: Chart on UK – Market size and forecast 2021-2026 ($ million)
- Exhibit 87: Data Table on UK – Market size and forecast 2021-2026 ($ million)
- Exhibit 88: Chart on UK – Year-over-year growth 2021-2026 (%)
- Exhibit 89: Data Table on UK – Year-over-year growth 2021-2026 (%)
- 7.12 Japan – Market size and forecast 2021-2026
- Exhibit 90: Chart on Japan – Market size and forecast 2021-2026 ($ million)
- Exhibit 91: Data Table on Japan – Market size and forecast 2021-2026 ($ million)
- Exhibit 92: Chart on Japan – Year-over-year growth 2021-2026 (%)
- Exhibit 93: Data Table on Japan – Year-over-year growth 2021-2026 (%)
- 7.13 Market opportunity by geography
- Exhibit 94: Market opportunity by geography ($ million)
8 Drivers, Challenges, and Trends
- 8.1 Market drivers
- 8.2 Market challenges
- 8.3 Impact of drivers and challenges
- Exhibit 95: Impact of drivers and challenges in 2021 and 2026
- 8.4 Market trends
9 Vendor Landscape
- 9.1 Overview
- 9.2 Vendor landscape
- Exhibit 96: Overview on Criticality of inputs and Factors of differentiation
- 9.3 Landscape disruption
- Exhibit 97: Overview on factors of disruption
- 9.4 Industry risks
- Exhibit 98: Impact of key risks on business
10 Vendor Analysis
- 10.1 Vendors covered
- Exhibit 99: Vendors covered
- 10.2 Market positioning of vendors
- Exhibit 100: Matrix on vendor position and classification
- 10.3 Alphabet Inc.
- Exhibit 101: Alphabet Inc. – Overview
- Exhibit 102: Alphabet Inc. – Business segments
- Exhibit 103: Alphabet Inc. – Key news
- Exhibit 104: Alphabet Inc. – Key offerings
- Exhibit 105: Alphabet Inc. – Segment focus
- 10.4 Amazon.com Inc.
- Exhibit 106: Amazon.com Inc. – Overview
- Exhibit 107: Amazon.com Inc. – Business segments
- Exhibit 108: Amazon.com Inc. – Key news
- Exhibit 109: Amazon.com Inc. – Key offerings
- Exhibit 110: Amazon.com Inc. – Segment focus
- 10.5 Clarifai Inc.
- Exhibit 111: Clarifai Inc. – Overview
- Exhibit 112: Clarifai Inc. – Product / Service
- Exhibit 113: Clarifai Inc. – Key offerings
- 10.6 International Business Machines Corp.
- Exhibit 114: International Business Machines Corp. – Overview
- Exhibit 115: International Business Machines Corp. – Business segments
- Exhibit 116: International Business Machines Corp. – Key offerings
- Exhibit 117: International Business Machines Corp. – Segment focus
- 10.7 Intel Corp.
- Exhibit 118: Intel Corp. – Overview
- Exhibit 119: Intel Corp. – Business segments
- Exhibit 120: Intel Corp. – Key news
- Exhibit 121: Intel Corp. – Key offerings
- Exhibit 122: Intel Corp. – Segment focus
- 10.8 Micron Technology Inc.
- Exhibit 123: Micron Technology Inc. – Overview
- Exhibit 124: Micron Technology Inc. – Business segments
- Exhibit 125: Micron Technology Inc. – Key offerings
- Exhibit 126: Micron Technology Inc. – Segment focus
- 10.9 Microsoft Corp.
- Exhibit 127: Microsoft Corp. – Overview
- Exhibit 128: Microsoft Corp. – Business segments
- Exhibit 129: Microsoft Corp. – Key news
- Exhibit 130: Microsoft Corp. – Key offerings
- Exhibit 131: Microsoft Corp. – Segment focus
- 10.10 NVIDIA Corp.
- Exhibit 132: NVIDIA Corp. – Overview
- Exhibit 133: NVIDIA Corp. – Business segments
- Exhibit 134: NVIDIA Corp. – Key news
- Exhibit 135: NVIDIA Corp. – Key offerings
- Exhibit 136: NVIDIA Corp. – Segment focus
- 10.11 Qualcomm Inc.
- Exhibit 137: Qualcomm Inc. – Overview
- Exhibit 138: Qualcomm Inc. – Business segments
- Exhibit 139: Qualcomm Inc. – Key news
- Exhibit 140: Qualcomm Inc. – Key offerings
- Exhibit 141: Qualcomm Inc. – Segment focus
- 10.12 Samsung Electronics Co. Ltd.
- Exhibit 142: Samsung Electronics Co. Ltd. – Overview
- Exhibit 143: Samsung Electronics Co. Ltd. – Business segments
- Exhibit 144: Samsung Electronics Co. Ltd. – Key news
- Exhibit 145: Samsung Electronics Co. Ltd. – Key offerings
- Exhibit 146: Samsung Electronics Co. Ltd. – Segment focus
11 Appendix
- 11.1 Scope of the report
- 11.2 Inclusions and exclusions checklist
- Exhibit 147: Inclusions checklist
- Exhibit 148: Exclusions checklist
- 11.3 Currency conversion rates for US$
- Exhibit 149: Currency conversion rates for US$
- 11.4 Research methodology
- Exhibit 150: Research methodology
- Exhibit 151: Validation techniques employed for market sizing
- Exhibit 152: Information sources
- 11.5 List of abbreviations
- Exhibit 153: List of abbreviations
About Technavio
Technavio is a leading global technology research and advisory company. Their research and analysis focuses on emerging market trends and provides actionable insights to help businesses identify market opportunities and develop effective strategies to optimize their market positions.
With over 500 specialized analysts, Technavio’s report library consists of more than 17,000 reports, covering 800 technologies spanning 50 countries. Their client base consists of enterprises of all sizes, including more than 100 Fortune 500 companies. This growing client base relies on Technavio’s comprehensive coverage, extensive research, and actionable market insights to identify opportunities in existing and potential markets and assess their competitive positions within changing market scenarios.
Contacts
Technavio Research
Jesse Maida
Media & Marketing Executive
US: +1 844 364 1100
UK: +44 203 893 3200
Email: media@technavio.com
Website: www.technavio.com/
![]()
![]() View original content to download multimedia:https://www.prnewswire.com/news-releases/ai-image-recognition-market—60-of-growth-to-originate-from-north-america-bfsi-segment-to-be-significant-for-revenue-generationtechnavio-301547013.html
View original content to download multimedia:https://www.prnewswire.com/news-releases/ai-image-recognition-market—60-of-growth-to-originate-from-north-america-bfsi-segment-to-be-significant-for-revenue-generationtechnavio-301547013.html
SOURCE Technavio

Source link
The content is by PR Newswire. Headlines of Today Media is not responsible for the content provided or any links related to this content. Headlines of Today Media is not responsible for the correctness, topicality or the quality of the content.